


As the second quarter closed yesterday, XRP’s on-chain activity flashed a bearish signal for holders. The token saw a sharp uptick in the movement of dormant tokens, a trend that signals one thing: distribution.
When long-held coins suddenly become active, it suggests that long-term holders (LTHs) are offloading their assets, possibly in anticipation of downside risks. The question now is whether these holders foresee further declines as Q3 begins.
Dormant XRP Tokens Wake Up — Is a Sell-Off Incoming?
According to on-chain data provider Santiment, XRP’s Dormant Circulation (90 days) metric surged to 387.19 million on Monday, the highest level in three weeks.
This metric tracks the total volume of tokens that had previously remained inactive for at least 90 days but suddenly moved within a 24-hour period. Such a sharp increase signals that LTHs are moving their tokens.
Historically, spikes in dormant circulation have indicated seasoned holders exiting positions, either to take profit or avoid potential losses. This trend therefore puts XRP at risk of noting declines.
Further, after a steady decline that began on June 5, XRP’s Liveliness suddenly reversed course yesterday, climbing to 0.809.
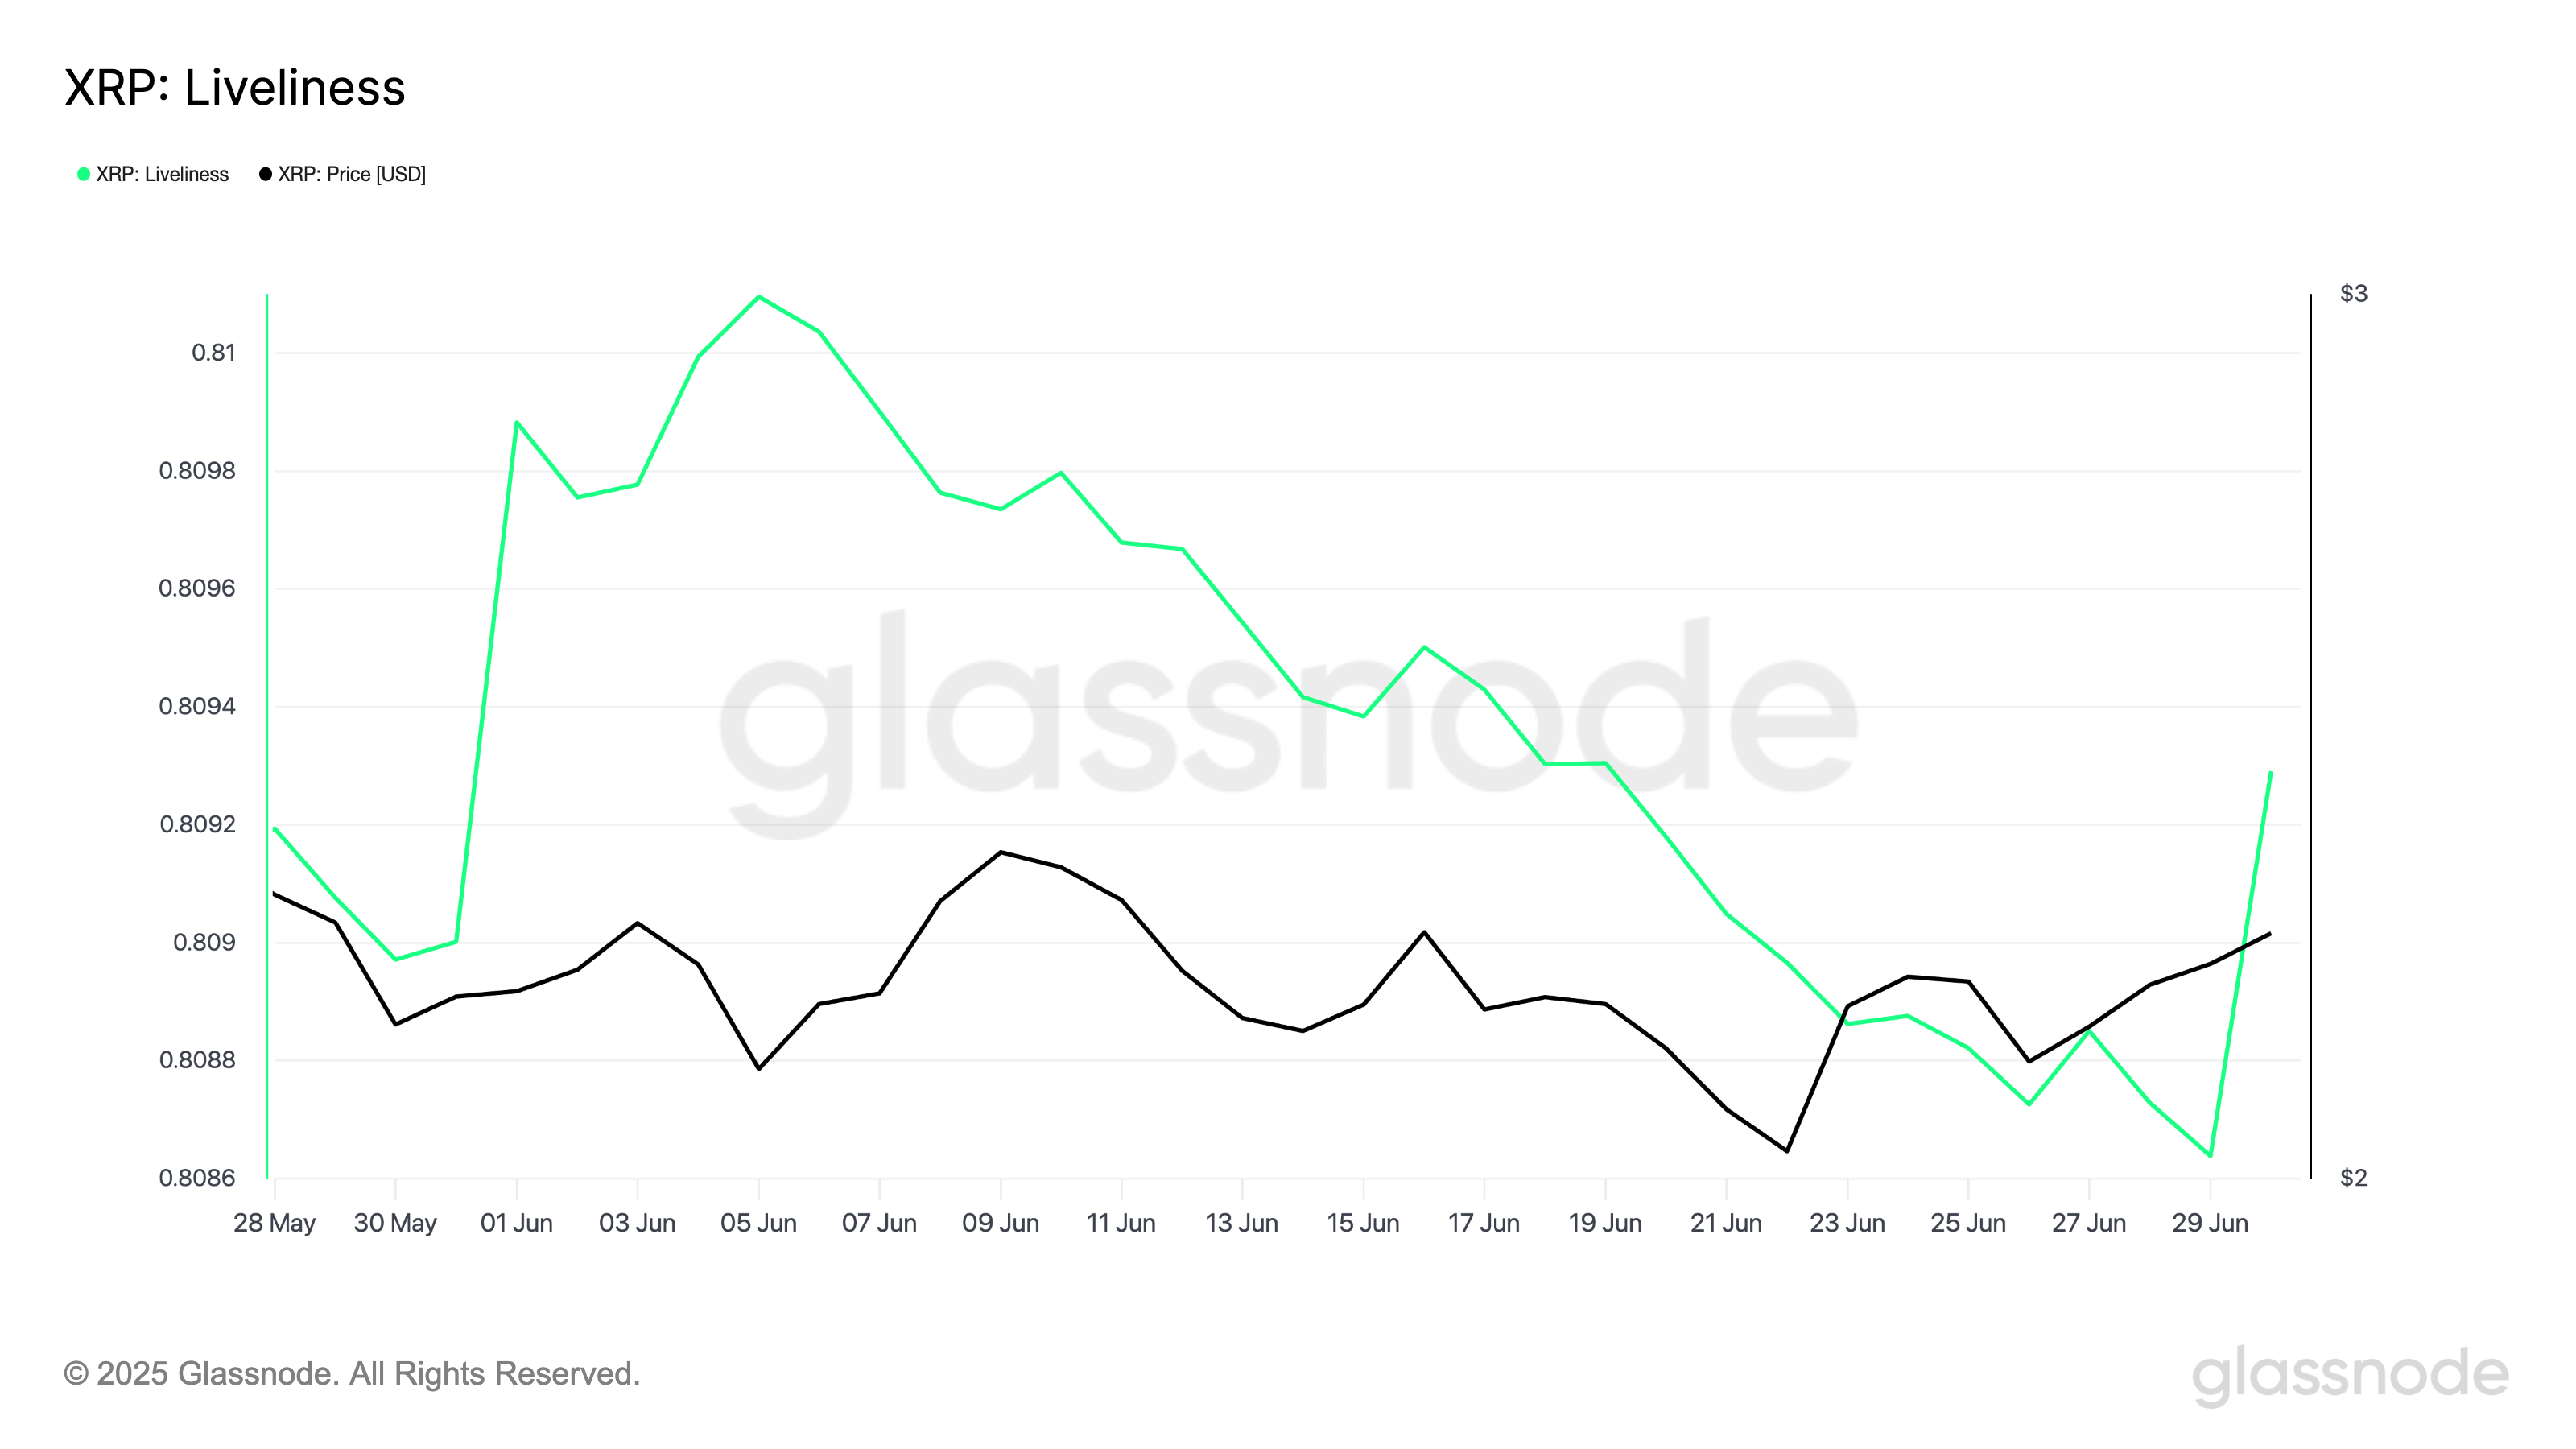
Liveliness measures the movement of long-held tokens by calculating the ratio of coin days destroyed to the total coin days accumulated. When it declines, it indicates that LTHs are moving their assets off exchanges and opting to hold.
Converesly, when it climbs, it suggests that more dormant tokens are being moved or sold, signaling profit-taking by XRP LTHs.
XRP Faces Bearish Pressure as Sellers Take Control
On the daily chart, XRP’s negative Balance of Power (BoP) supports this bearish outlook. At press time, this momentum indicator is at -0.62.
The BoP indicator measures the strength between buyers and sellers by comparing price movements within a given period. When it turns negative, sellers are dominating the market, hinting at a potential downtrend.
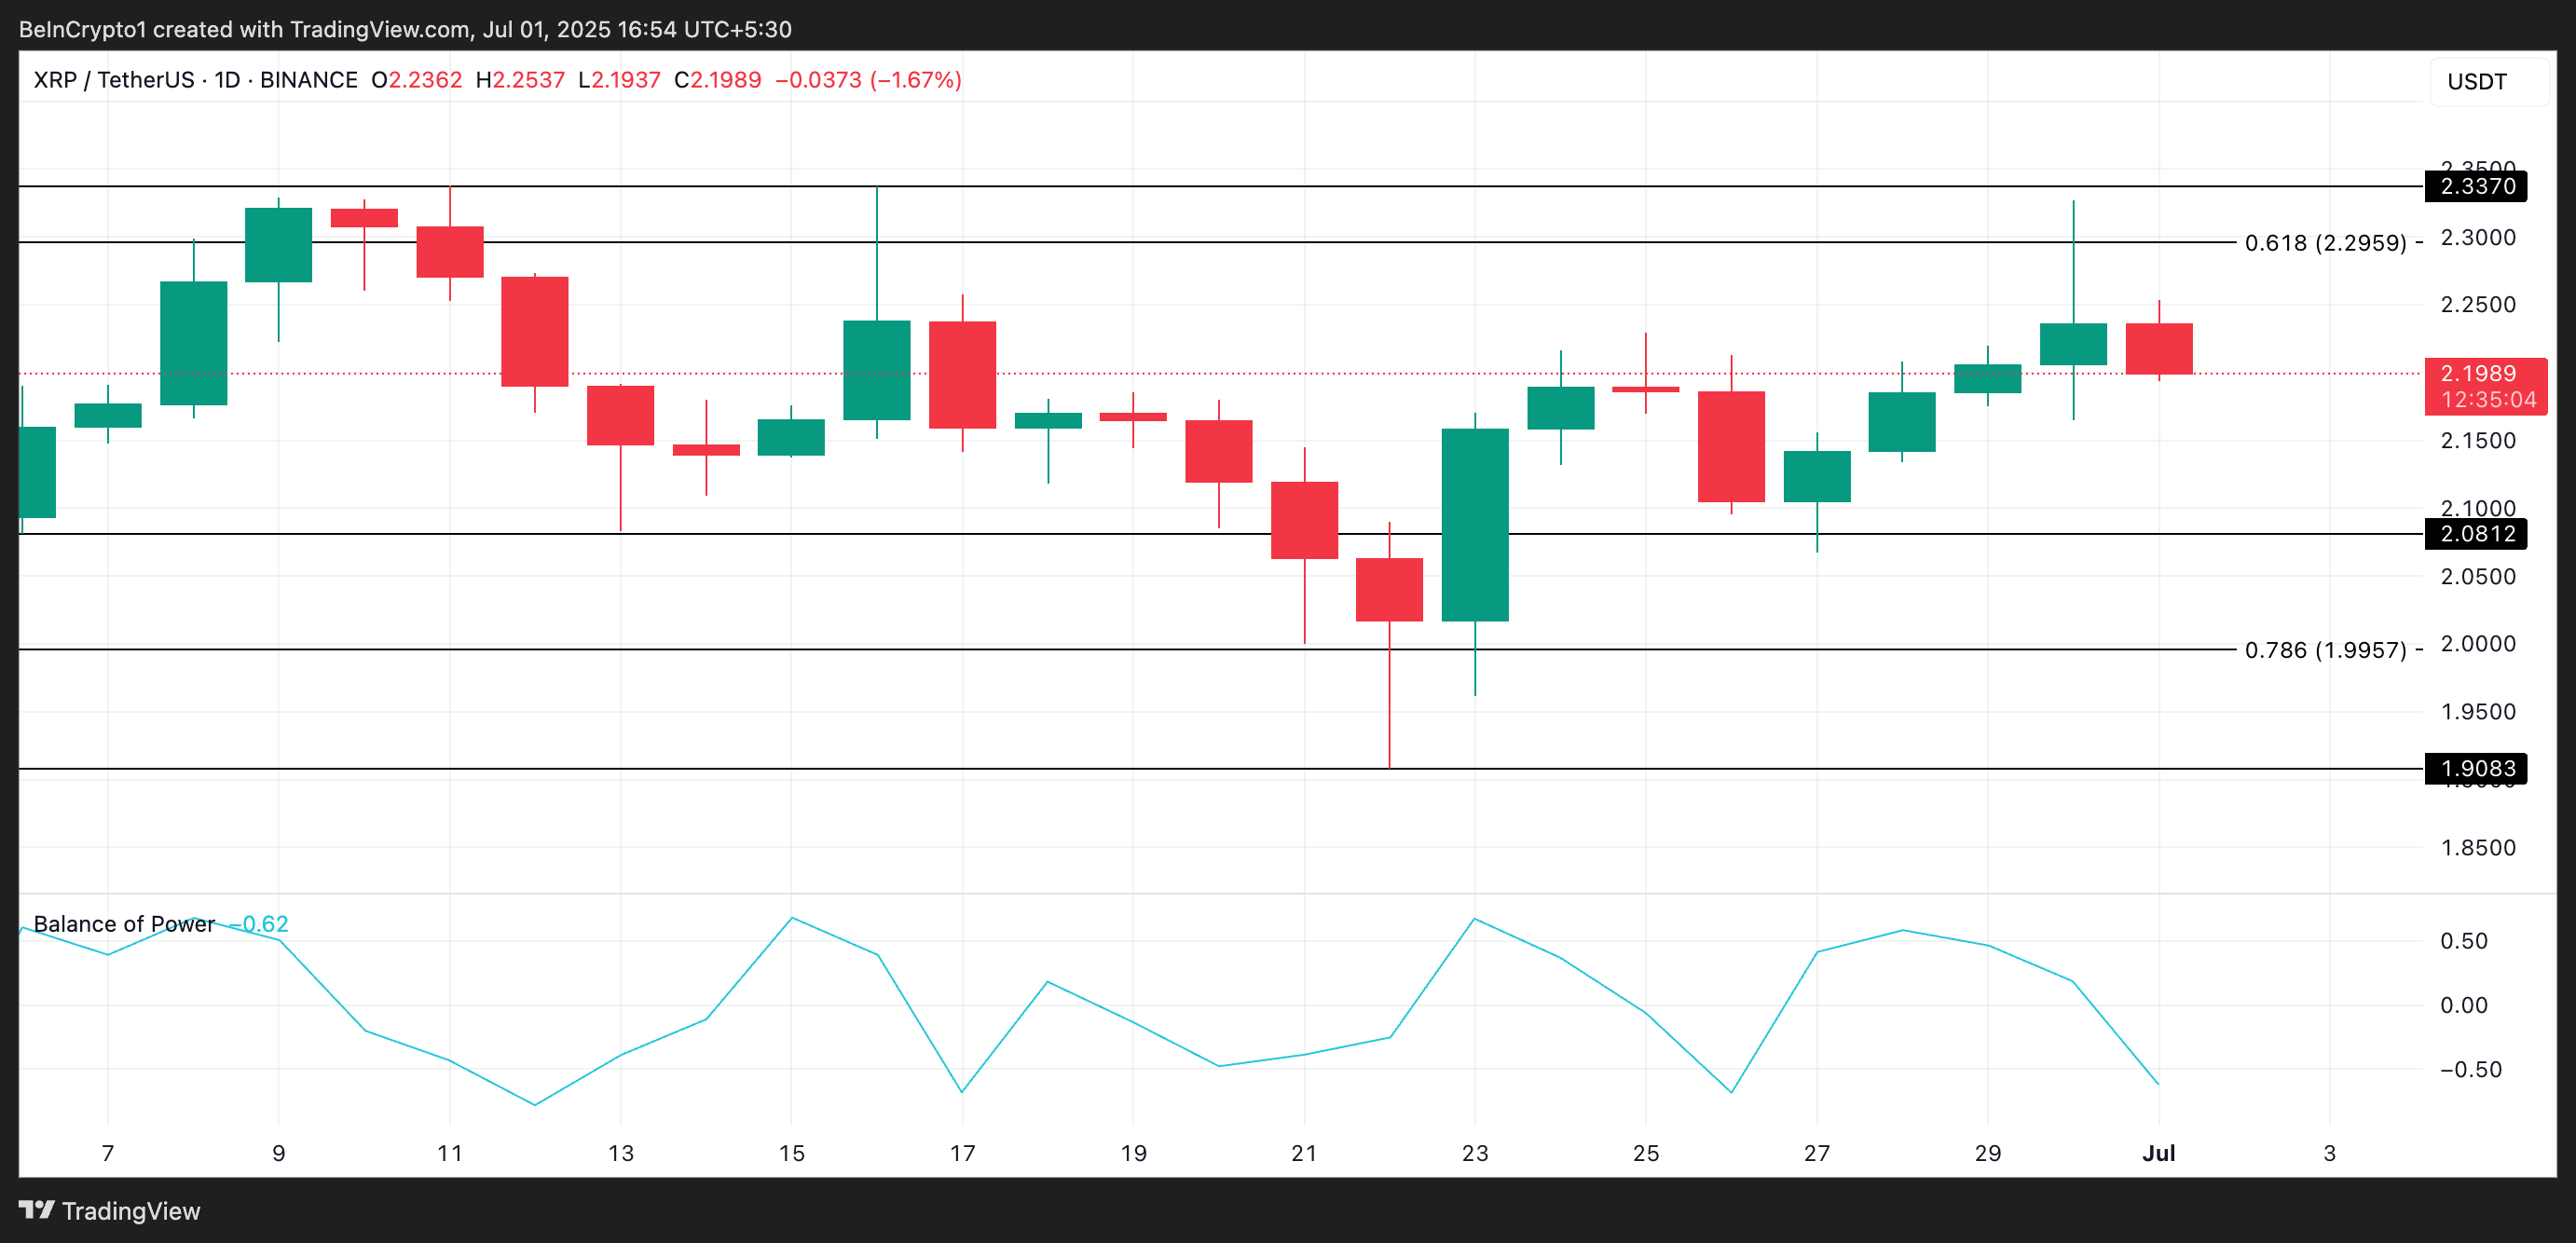
If this happens, XRP’s price could drop to $2.08.On the other hand, if demand soars, its price could reach $2.29.
Disclaimer
In line with the Trust Project guidelines, this price analysis article is for informational purposes only and should not be considered financial or investment advice. BeInCrypto is committed to accurate, unbiased reporting, but market conditions are subject to change without notice. Always conduct your own research and consult with a professional before making any financial decisions. Please note that our Terms and Conditions, Privacy Policy, and Disclaimers have been updated.