


In 2025, crypto markets entered a data-defined era. For years, investors relied on halving cycles, on-chain, and TVL charts to read sentiment. But the framework reshuffled.
This year, CEX spot volumes fell 27.7% while DEX activity grew 25.3%, and Henley counted over 240,000 crypto millionaires worldwide. With digital treasuries and institutions pouring billions, the question for 2026 is no longer where capital flows—but which on-chain metrics most reliably reveal the market’s next direction.
To unpack these shifts, BeInCrypto spoke with the Dune leadership team, whose analytics platform processes billions of blockchain events daily.
Stablecoins: Winners, Structural Adoption, and Velocity as 2026’s Key Metric
Stablecoins expanded from roughly $200 billion to $305 billion in 2025, reflecting deeper on-chain utility rather than short-term speculation. The leading issuers reveal where institutional liquidity has moved.
A Dune–Artemis report said total stablecoin supply rose 63% to $225 billion by February, processing $35 trillion in transfers. USDC doubled to $56 billion as USDT held $146 billion, while Ethena’s USDe hit $6.2 billion — proof that investors favor yield-backed tokens over speculation.
In an exclusive BeInCrypto interview, experts rejected Standard Chartered’s claim that stablecoins could drain $1 trillion from emerging-market banks.
Sponsored
Sponsored
Lisk’s Dominic Schwenter called the shift “evolution, not crisis,” while Cork Protocol’s Robert Schmitt described it as a “second Bretton Woods” expanding digital-dollar rails instead of threatening local banking systems.
“USDC doubled year over year to almost $80 billion in supply. Ethena’s USDe rose from about $2.4 billion to $14.8 billion, while Plasma—launched less than a month ago—has already reached $8 billion, ranking fifth by on-chain stablecoin supply. The growth is primarily structural in treasuries, DeFi lending, and RWA settlements rather than speculative demand.”
Dune analysts recommend tracking stablecoin velocity—the ratio of transaction volume to market capitalization—as the clearest metric in 2026. It separates active usage from hoarding behavior.
Tokenized RWAs: Treasuries Dominate, Bonds Catch Up
Tokenized real-world assets (RWAs) solidified their role in 2025 as institutions sought higher yields and diversification. Treasury and bond products drove the expansion, supported by deeper DeFi integration.
A Dune–RWA.xyz report found tokenized assets up 224% year to date, driven by US Treasuries and bonds. BlackRock’s BUIDL reached $2.2 billion, while private credit rose 61% to $15.9 billion.
Analysts said RWAs now anchor institutional liquidity and serve as a bridge between DeFi and traditional markets.
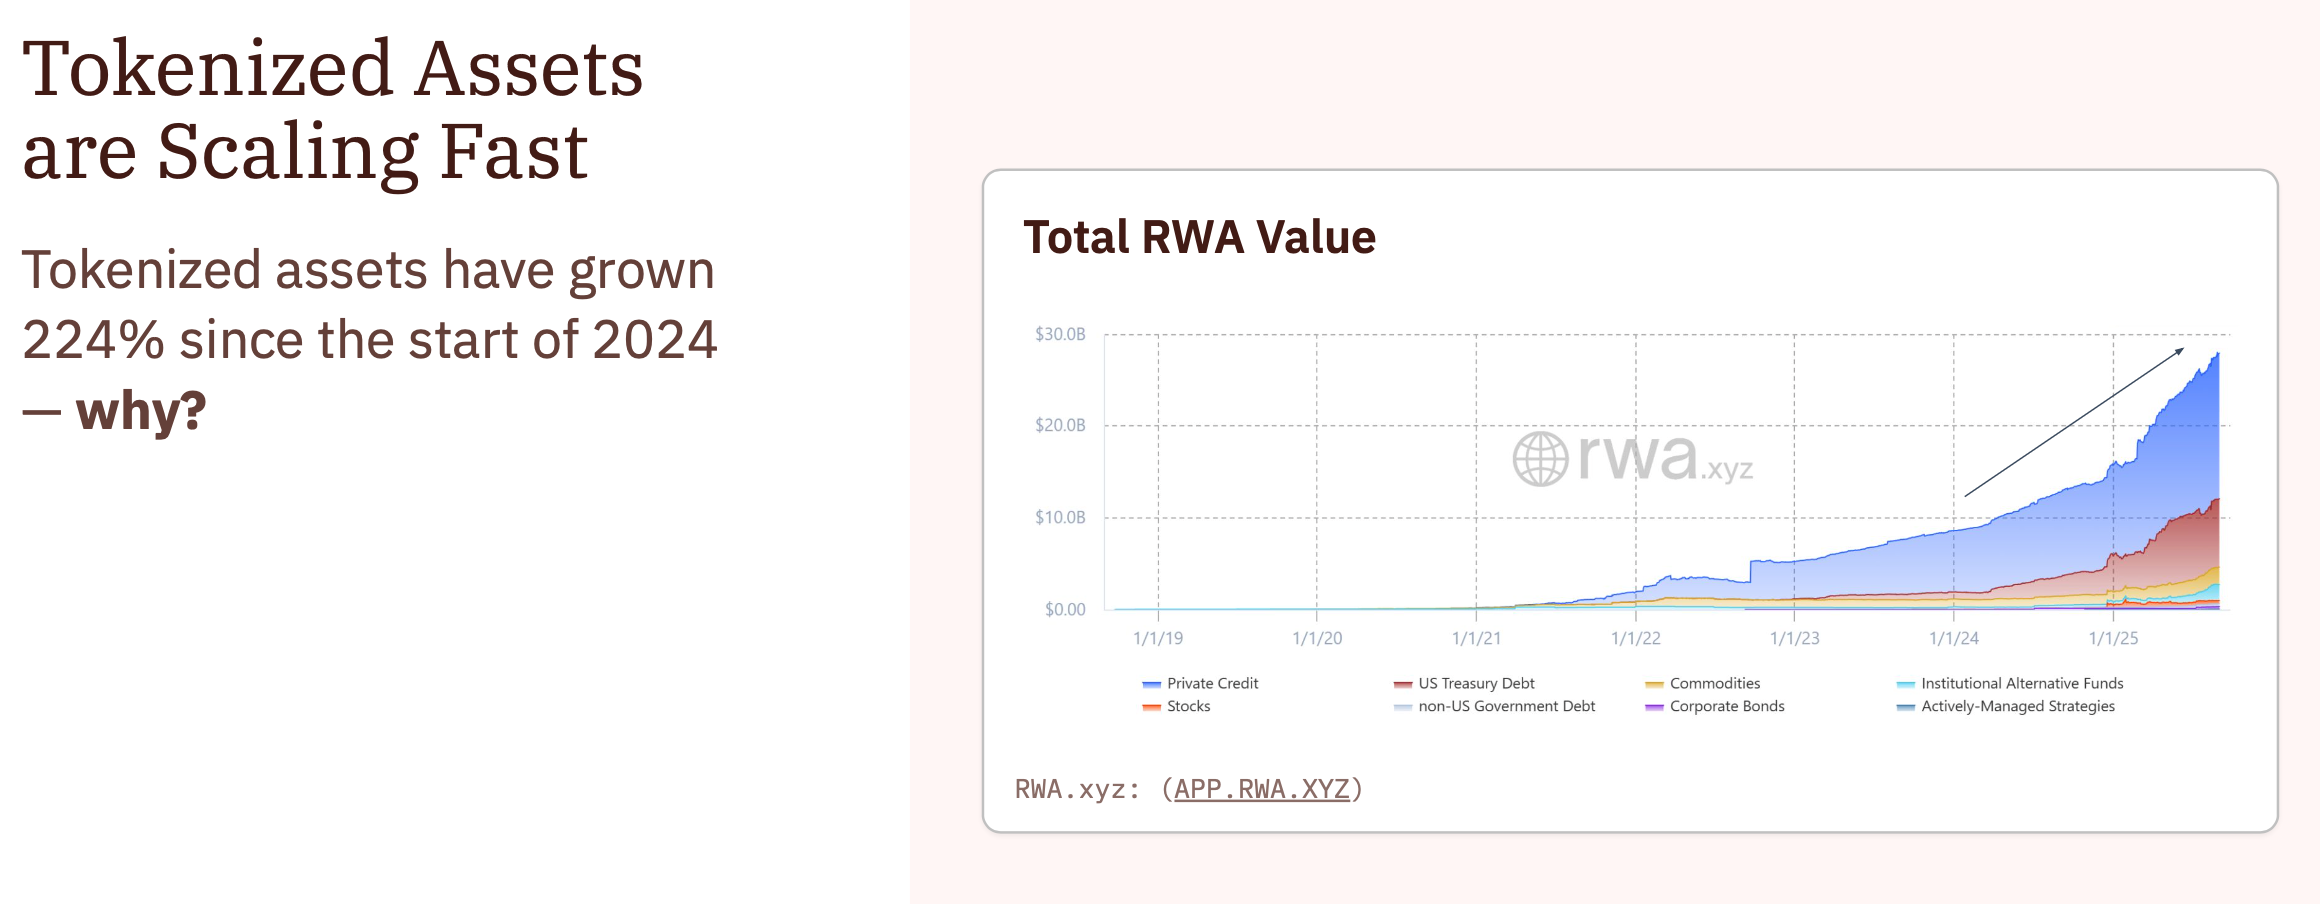
“U.S. Treasuries grew 224% year over year in TVL, bonds rose 171%, and private credit expanded 61% year to date to $15.9 billion. These categories are becoming the backbone of capital market restructuring. Interoperability and composable finance are driving participation.”
Dune’s 2025 RWA report highlights that year-over-year TVL growth and the number of unique holders remain the best indicators of institutional traction.
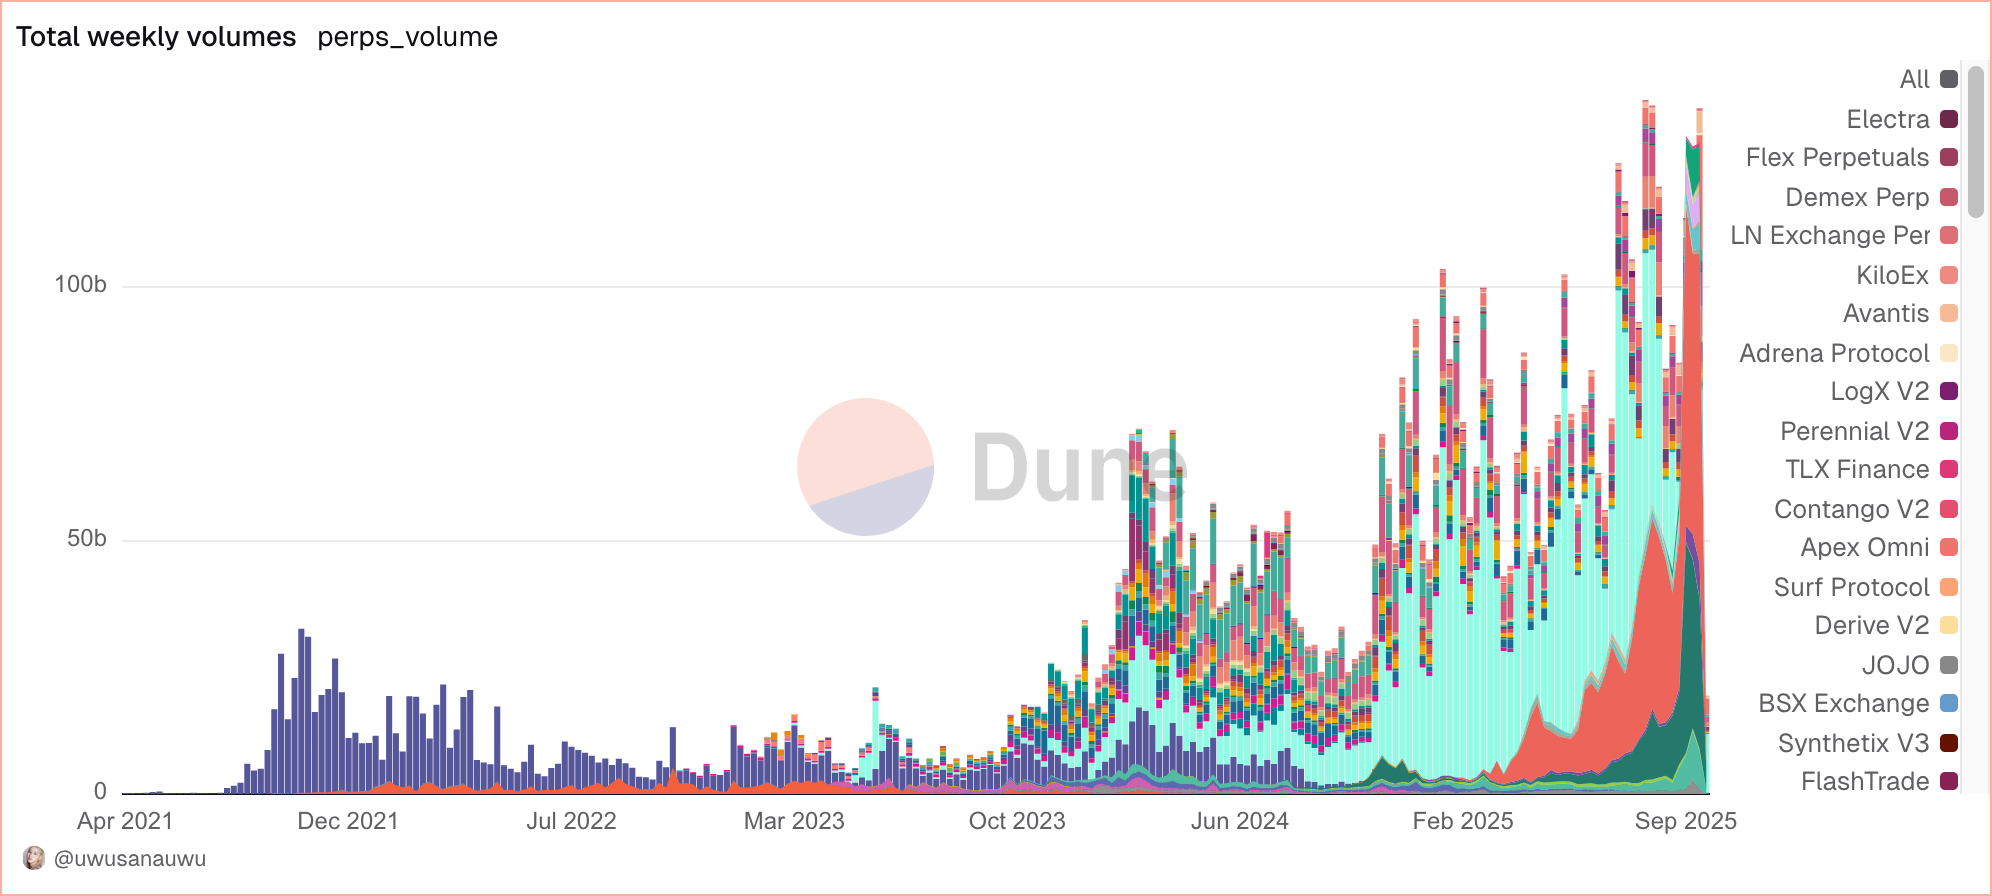
Perpetual DEX Volume and Emerging Risk Thresholds
Decentralized perpetuals surged past $2.6 trillion in annual volume. Open-interest concentration across top platforms now resembles the leverage clusters once seen on centralized derivatives markets.
Bitwise’s Max Shannon told BeInCrypto that if DEXs keep winning market share, volumes could reach $20–30 trillion within five years. He said leverage and trading churn are accelerating growth, with institutional uptake and clearer rules acting as key catalysts.
Sponsored
Sponsored
“The perps market exceeded $1 trillion in monthly volume. Hyperliquid, which dominated with over 70% of volume and 90% of open interest, now holds 30% of total volume and 50% of open interest. Aster on BNB Chain and Variational on Arbitrum are emerging competitors through yield-linked and peer-to-peer derivatives.”
Address concentration spikes have correlated with localized volatility. Monitoring on-chain open interest relative to total decentralized volume could serve as an early-warning threshold for systemic risk in 2026.
CEX–DEX Liquidity Migration: Structural, Not Temporary
In 2025, centralized and decentralized liquidity began to diverge. CEX deposits averaged $150 billion per month, while DEX volumes averaged $500 billion and peaked at $857 billion in July. This gap signals a structural—not transient—shift.
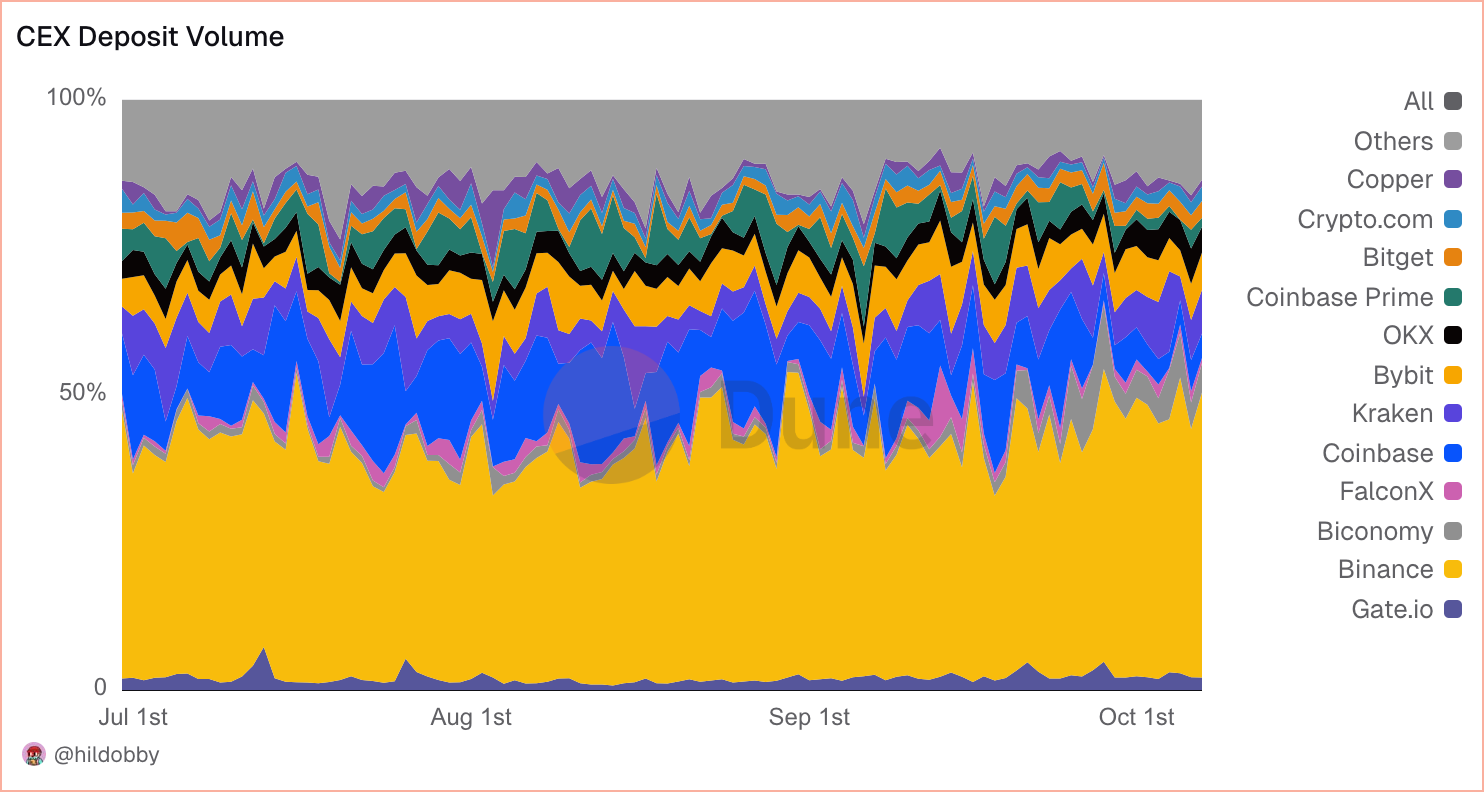
“Hildobby’s dashboards show that after November 2023, DEX volumes began to surpass CEXs. In 2025, decentralized spot reached $857 billion in monthly volume, compared with CEX deposits near $250 billion at their peak.”
Analysts interpret this divergence as a long-term rebalancing of liquidity toward permissionless venues, reinforced by improved user interfaces and institutional custody tools.
ETF Flows and On-Chain Reaction Lag
ETF inflows don’t appear directly on-chain but leave measurable traces. Correlations with stablecoin movements, mempool congestion, and gas-fee spikes have tightened, revealing near real-time liquidity reactions.
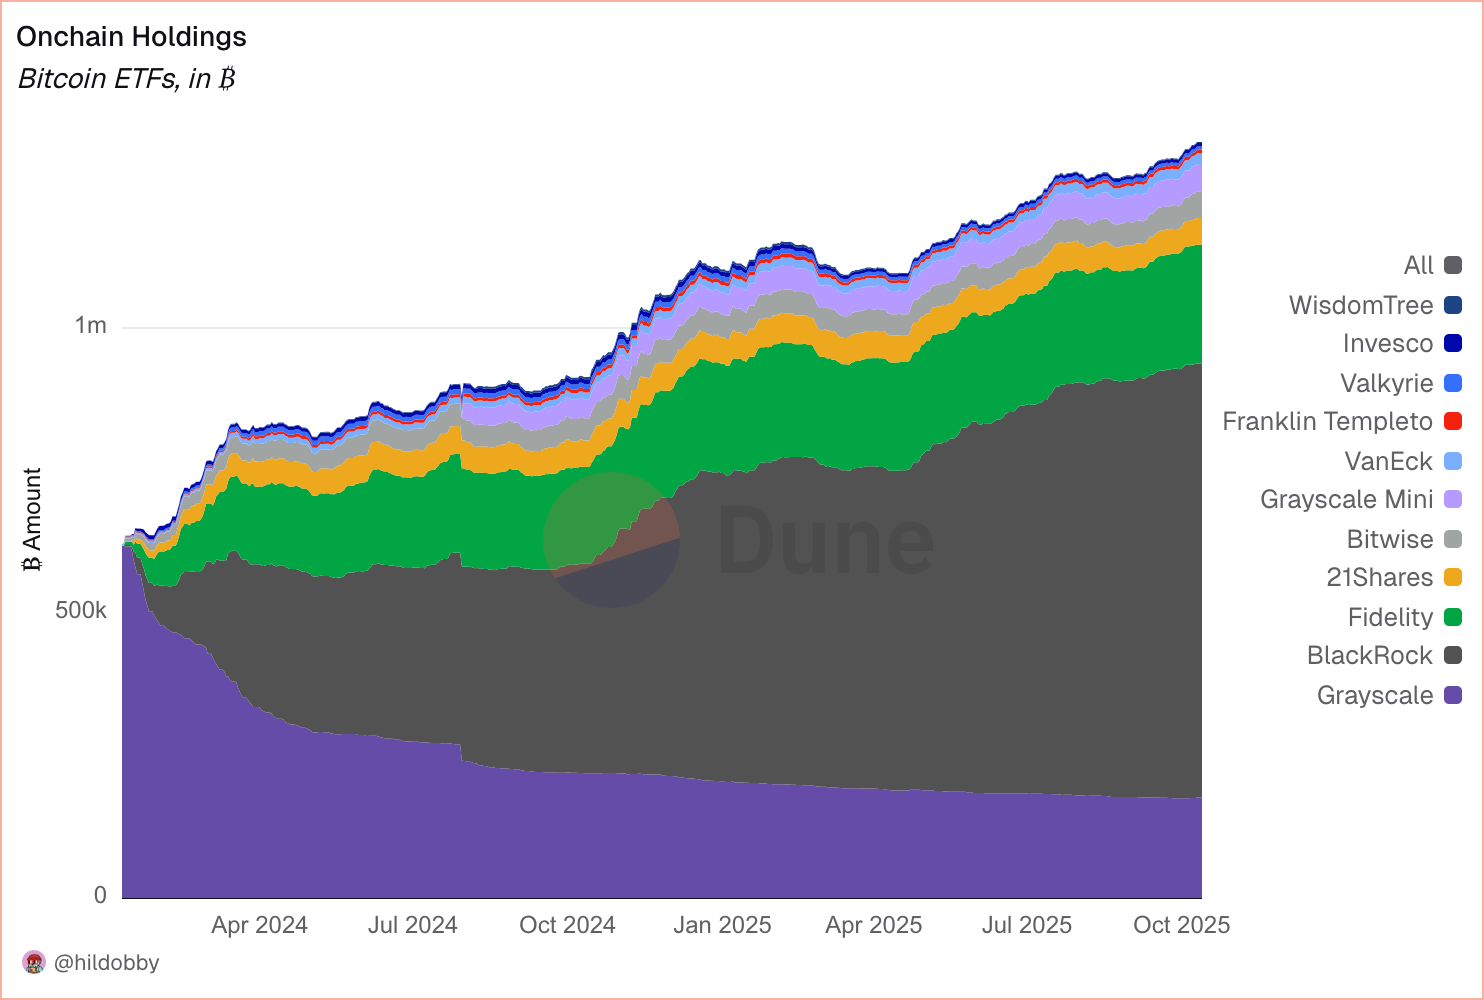
“Bitcoin ETFs now hold 1.325 million BTC—about 6.65% of supply—worth $149.8 billion, with a net inflow of 706,000 BTC since launch. IBIT leads with roughly 28.7% of AUM share. Bitcoin absorption runs at about 3.5% annualized, while Ethereum ETFs hold 6.75 million ETH (~5.44% of supply) worth $29.2 billion, growing 4.1% annualized. Stablecoin expansion remains the quickest on-chain reaction, typically within hours of ETF flow shifts.”
Checkonchain Analytics co-founder James told BeInCrypto that long-term investors are realizing $30–100 billion in monthly profits, slowing price gains despite strong demand.
Sponsored
Sponsored
“Some holders are moving from on-chain to ETFs, but they’re not the majority,” he said. “Institutional inflows remain massive—tens of billions of dollars. Since October 2024, IBIT has led the pack and is still the only fund with steady inflows. The US now holds about 90% of global ETF assets.”
Dune’s ETF dashboards confirm that on-chain liquidity tends to respond within hours of major ETF allocations. This positions stablecoin supply as the cleanest proxy for new inflows.
The Meme Coin Dilemma
Meme coins continued to dominate user onboarding in 2025, particularly across Solana-based launchpads. Yet while activity was frenetic, survivorship rates stayed near zero.
a16z CTO Eddy Lazzarin mentioned that the “casino-like” trend hurts crypto’s credibility and diverts talent from innovation.
Other VCs argue that meme trading keeps users engaged and on-chain, highlighting a divide between speculation and utility that defines the current cycle.
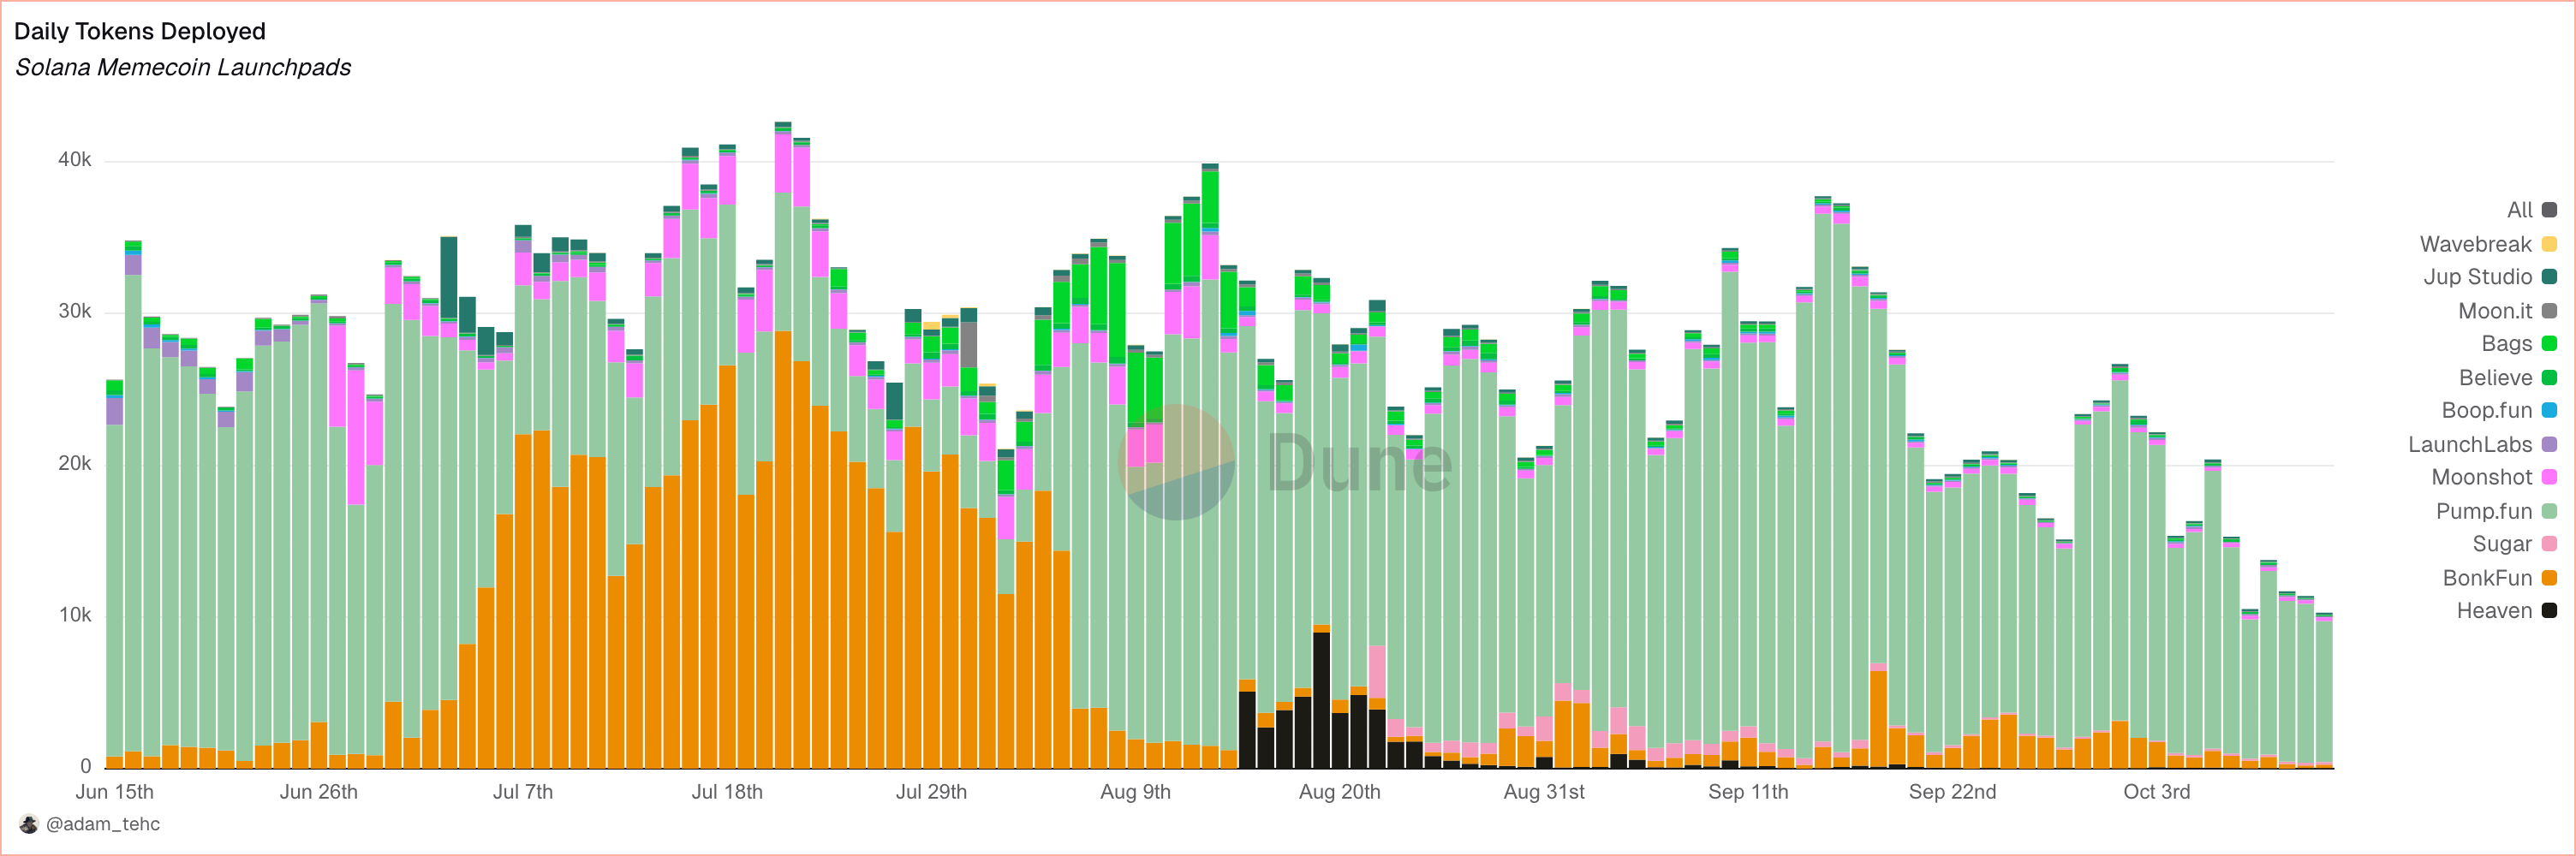
“In 24 hours, about 11,600 tokens launched across Solana platforms. Pump.fun alone hosted 10,704, but only 0.7–0.8% ‘graduated’ to liquidity. Pump.fun maintains around 79,600 daily active users and $63 million in daily volume, generating $602,000 in fees. Token-level retention is minimal, but platform-level engagement is robust.”
The data shows that meme coins remain strong entry funnels but rarely evolve into sustainable ecosystems. Platform-level DAUs and fee data are the key indicators to monitor.
New NFT Entrants Still Rising
Despite muted trading volumes, NFTs maintained a role as onboarding ramps. Minting data indicates new user inflows rather than contraction.
“Unique NFT buyers jumped from about 49 million in 2024 to more than 173 million during the first ten months of 2025. Mint volumes peaked at $78 billion in November 2024 and stabilized near $30 billion monthly. Secondary trades are smaller but consistent, returning to 2021 activity levels.”
Sponsored
Sponsored
The trend supports NFTs as continued gateways into crypto, though secondary market depth remains limited compared with early-cycle peaks.
DePIN and DeSci: Utility Outpaces Hype
Beyond tokenization and ETFs, DePIN and DeSci sectors expanded quietly in 2025. On-chain data suggests fundamentals, not speculation, are driving adoption.
NodeOps co-founder Naman Kabra said the sector “isn’t dead—it’s maturing.” He said DePIN’s shift from hype to infrastructure mirrors Bitcoin’s early evolution and “filters out projects that can’t deliver real utility.”
The Dune “Onchain Layer of Solana DePIN” report counted 238,000 active nodes across Helium, Hivemapper, and Render, with nearly $6 million in on-chain revenue. Kabra said the sector’s “boring trajectory” shows lasting value as decentralized infrastructure becomes everyday infrastructure.
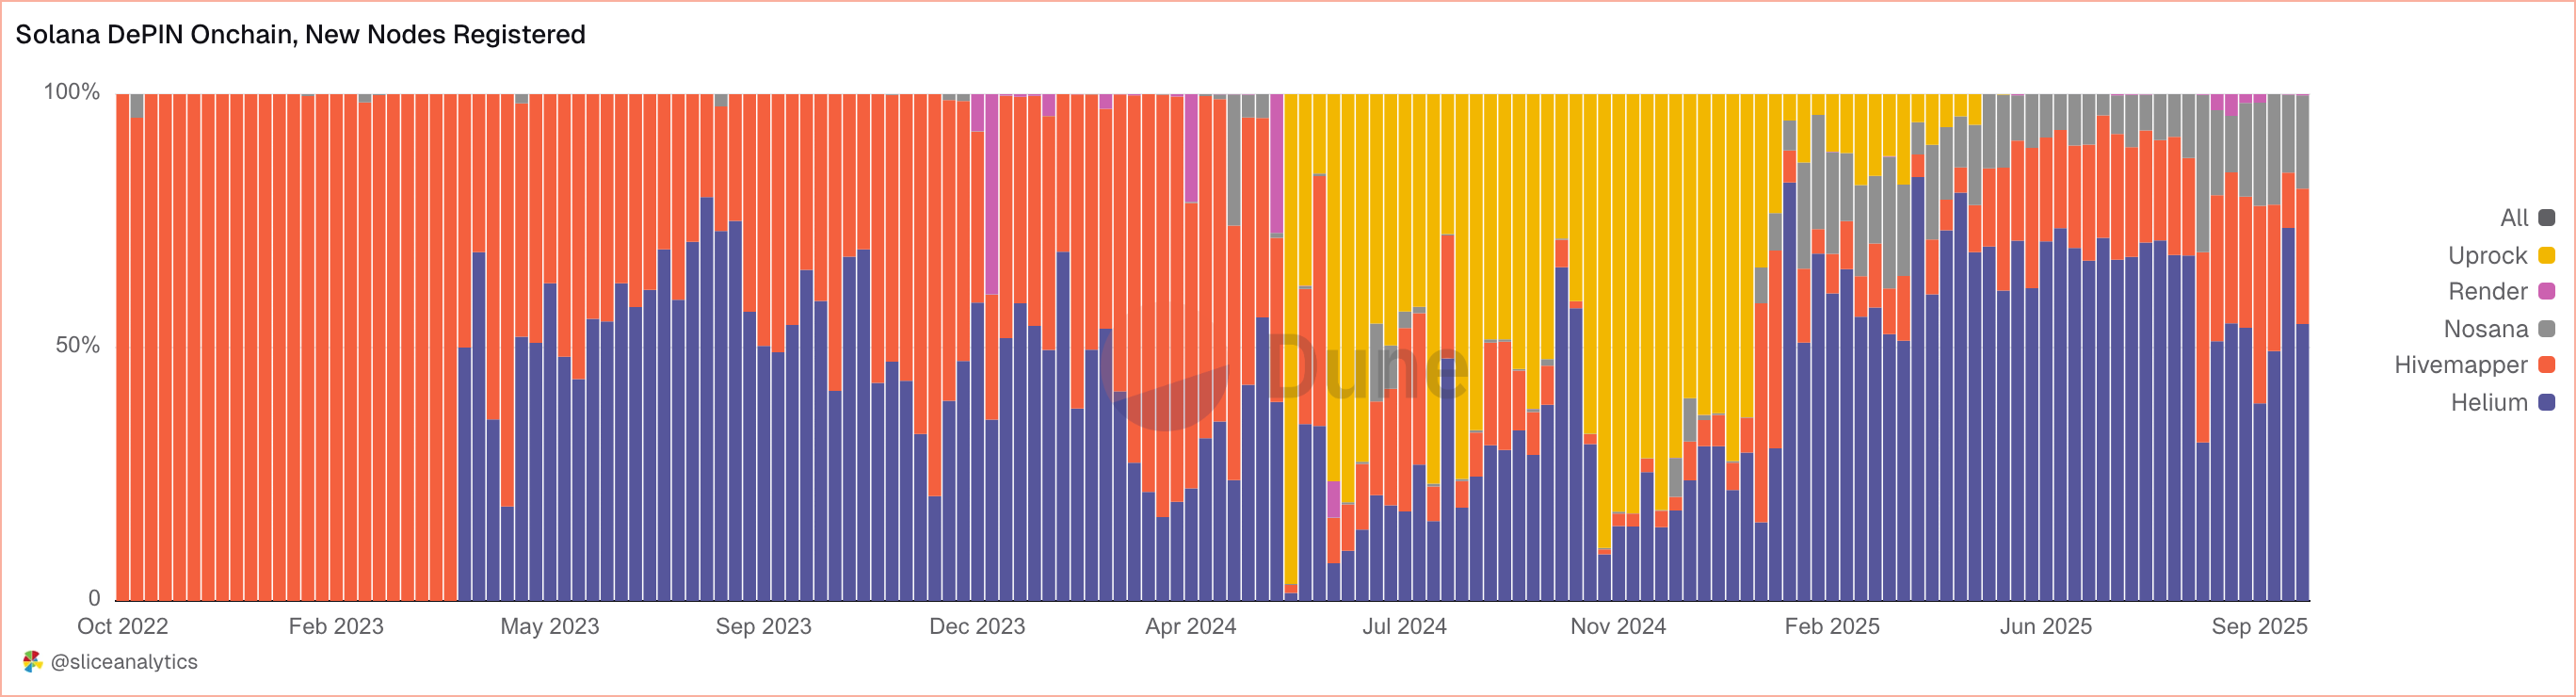
“Helium Mobile reached 462,064 subscribers and 84,343 nodes, adding over 10,000 new users weekly. XNET contributors rose 8% to 827, and Nosana processed 2.4 million compute jobs. Hivemapper and Render showed steady growth. Watch node counts, contributors, and jobs completed—they’re the cleanest demand indicators.”
DePIN’s physical infrastructure growth and DeSci’s research financing models illustrate crypto’s gradual integration into real-world productivity sectors.
2026’s Most Predictive Indicator: Stablecoin Supply
As market capitalization passed $3.5 trillion and Bitcoin dominance rose above 62%, one metric consistently anticipated price action.
“If you track just one on-chain metric in 2026, make it stablecoin supply. It’s the clearest proxy for new capital. Stablecoin growth shows roughly 0.87 correlation with BTC and often leads rallies. Exchange balances represent dry powder for the next move.”
Stablecoin expansion continues to outperform ETF flows and funding rates as a predictive measure, defining the liquidity tide heading into 2026.
Conclusion: On-chain Data is Shaping Crypto’s Next Wave
Dune’s 2025 analytics depict a maturing market anchored in data precision. Stablecoins remain liquidity’s backbone, RWAs institutionalize yield, and DePIN signals functional expansion.
As 2026 approaches, on-chain intelligence is not supplementary—it’s sovereign. For investors, the edge lies in interpreting signals faster and cleaner than the crowd.