


Solana (SOL) is flashing warning signs again. It may have gained nearly 9% over the past week, but the Solana price is still down around 6% for the month — a clear sign that buyers are losing momentum. On-chain data shows that long-term holders are cutting exposure and large investors are staying on the sidelines.
Together, these trends point to a growing risk of a short-term pullback that could extend beyond 3% if key support levels give way.
Sponsored
Sponsored
Holders Drive the Selling as Big Money Stays Cautious
Steady outflows from mid- and long-term holders are undermining Solana’s recent strength. Glassnode’s HODL Waves metric — which tracks how long coins stay untouched before being moved — shows a clear drop among conviction holders.
Wallets holding Solana for 1–2 years have reduced their share of the supply from 20.33% to 18.48%, while 3–6 month holders fell from 12.7% to 11.55% this month.
Want more token insights like this? Sign up for Editor Harsh Notariya’s Daily Crypto Newsletter here.
This change signals profit-taking among patient investors, a bearish development that often precedes short-term corrections.
The Chaikin Money Flow (CMF) — a tool that measures big-money inflows and outflows — adds to this view. After briefly rising above zero on October 27, CMF turned negative again and has failed to recover since. That means institutional buyers are not adding aggressively, even after recent dips.
Sponsored
Sponsored
During recovery or range-bound moves, these big money flows often offset the cohort-based selling waves. That isn’t happening currently. Instead, CMF turning negative is adding to the “sell” pressure, strengthening the Solana price pullback narrative.
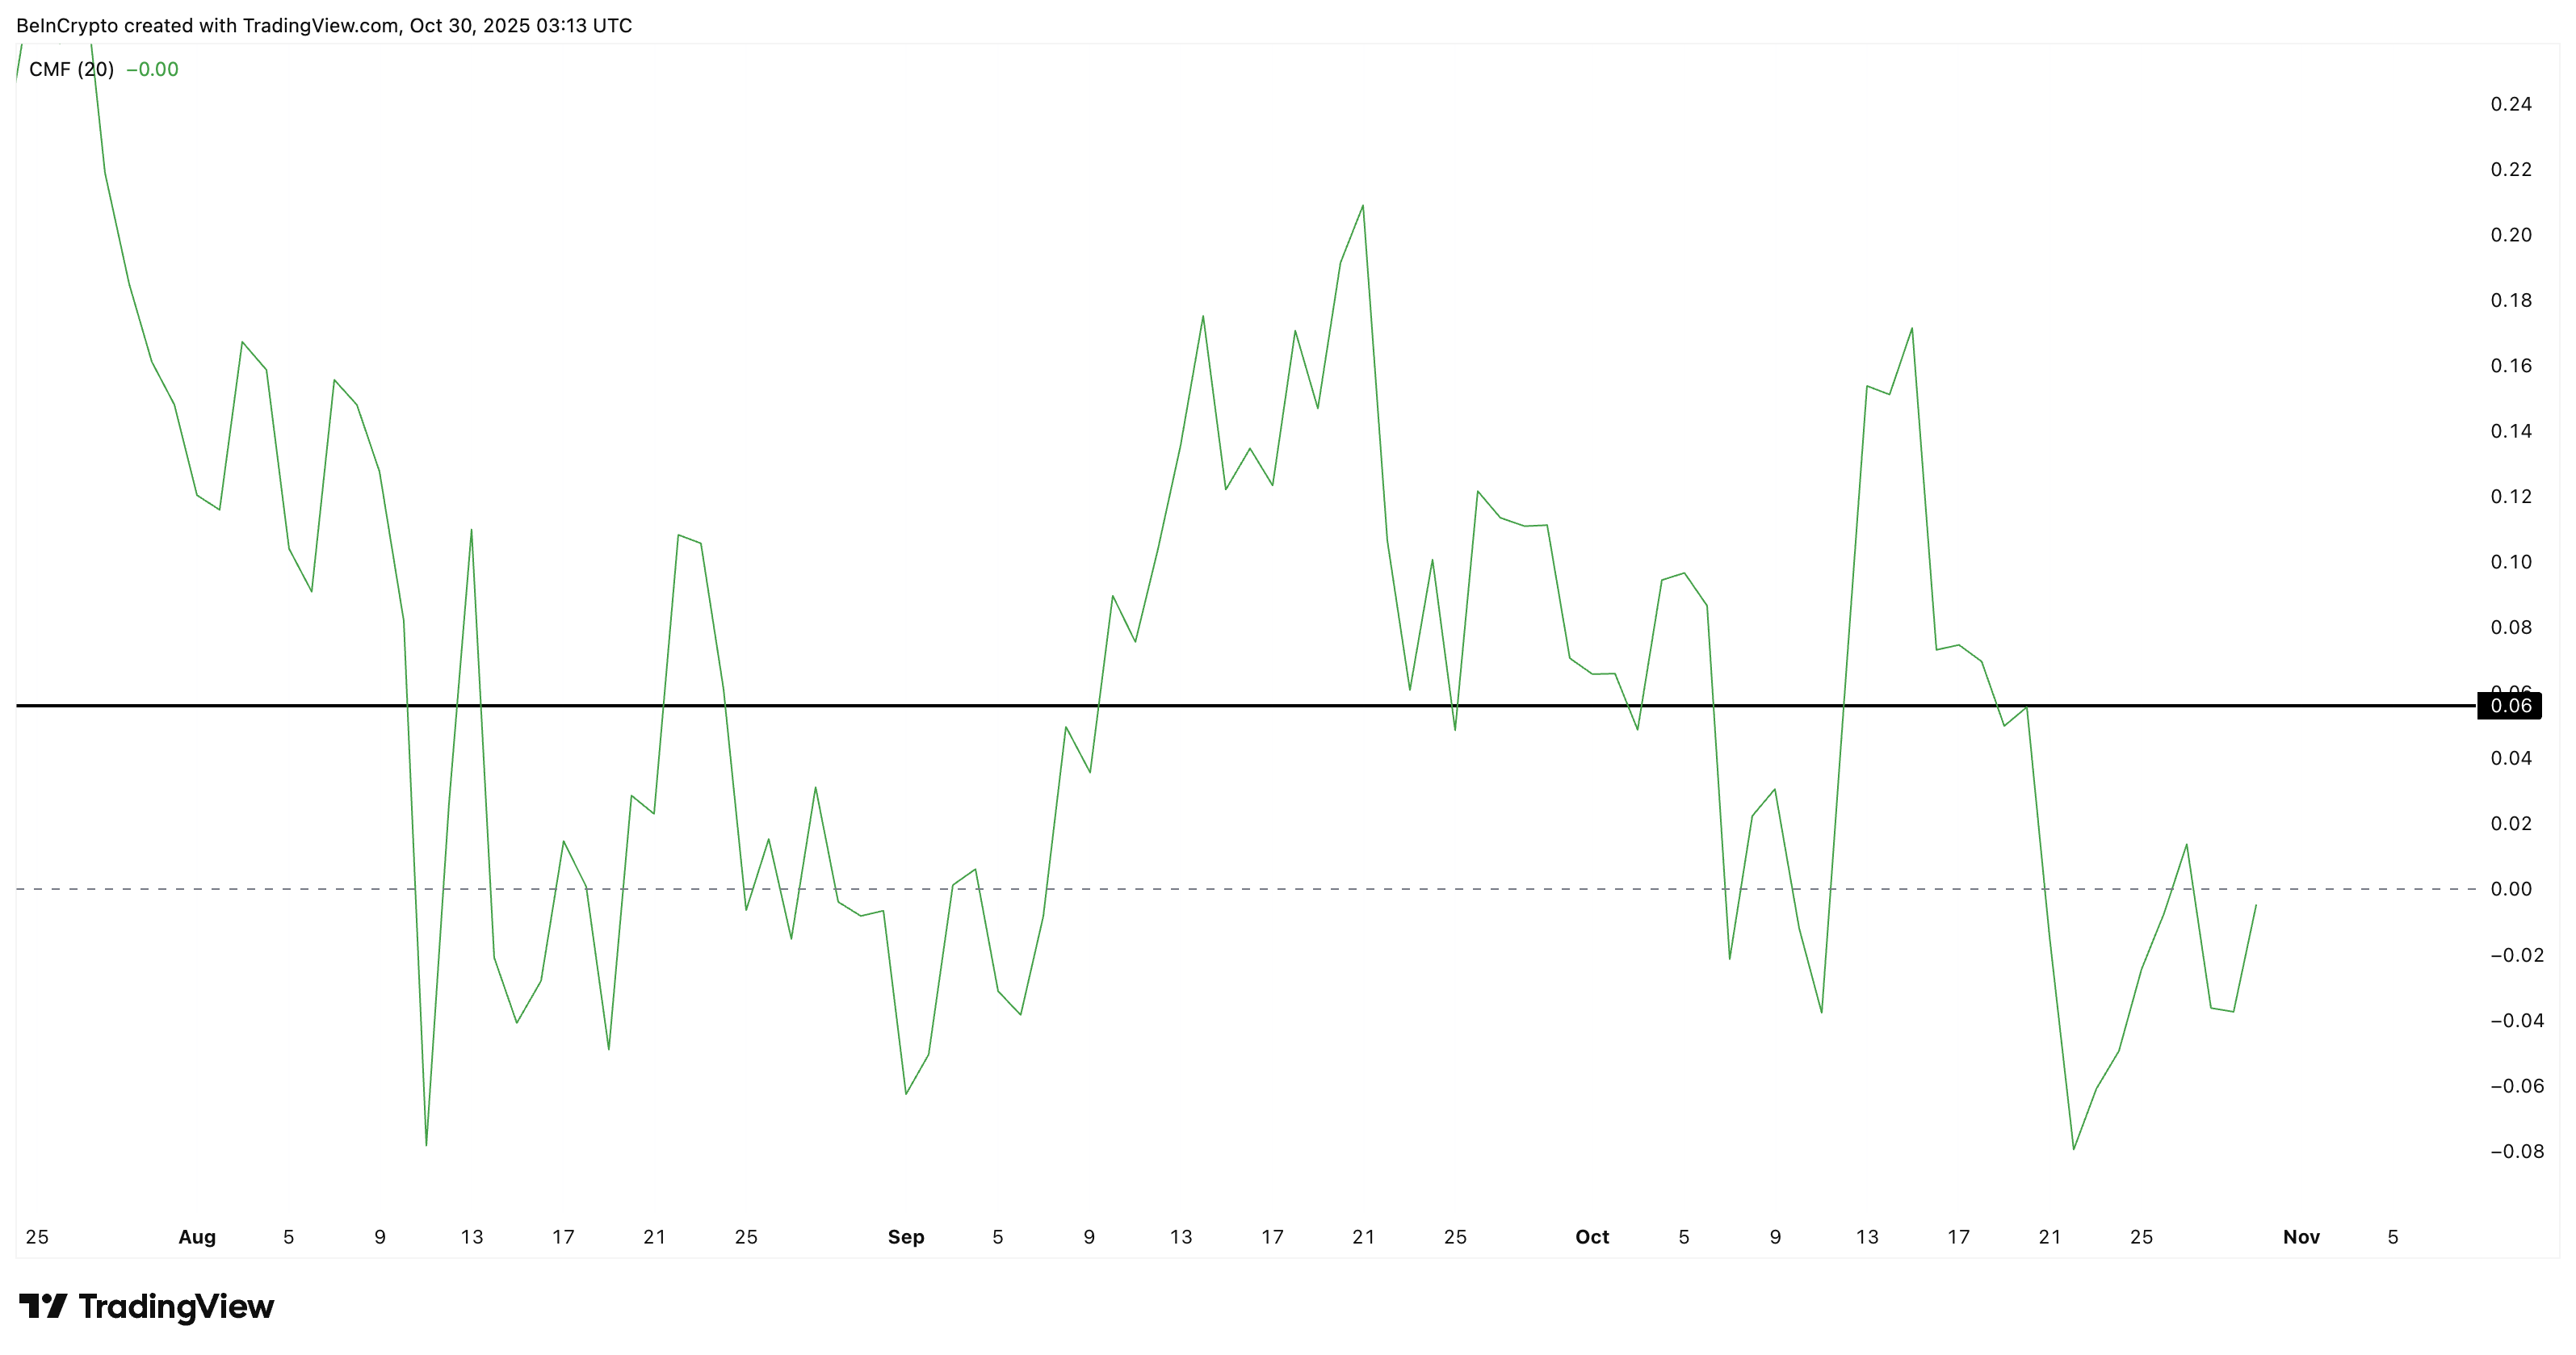
Unless CMF climbs back above 0.06, Solana’s recovery will likely stay weak. These combined on-chain and big-money signals show why sellers remain in control despite last week’s bounce.
Weak Structure Points to Another Leg Down For The Solana Price
On the daily chart, Solana’s pattern supports the bearish setup. Between October 13 and October 30, the SOL price formed a lower high. The Relative Strength Index (RSI) — which measures buying and selling strength — made a higher high.
This formation is a hidden bearish divergence, and often appears before trend continuation to the downside. It shows that even though the momentum indicator rose, the actual price couldn’t keep up, indicating that selling pressure still dominates.
Solana has already slipped 6% over the past 30 days (a downtrend signal), suggesting this hidden divergence could soon play out. If the price falls below $192 (about 3% below the current level), it may confirm the start of a deeper pullback toward $182 and possibly $161.
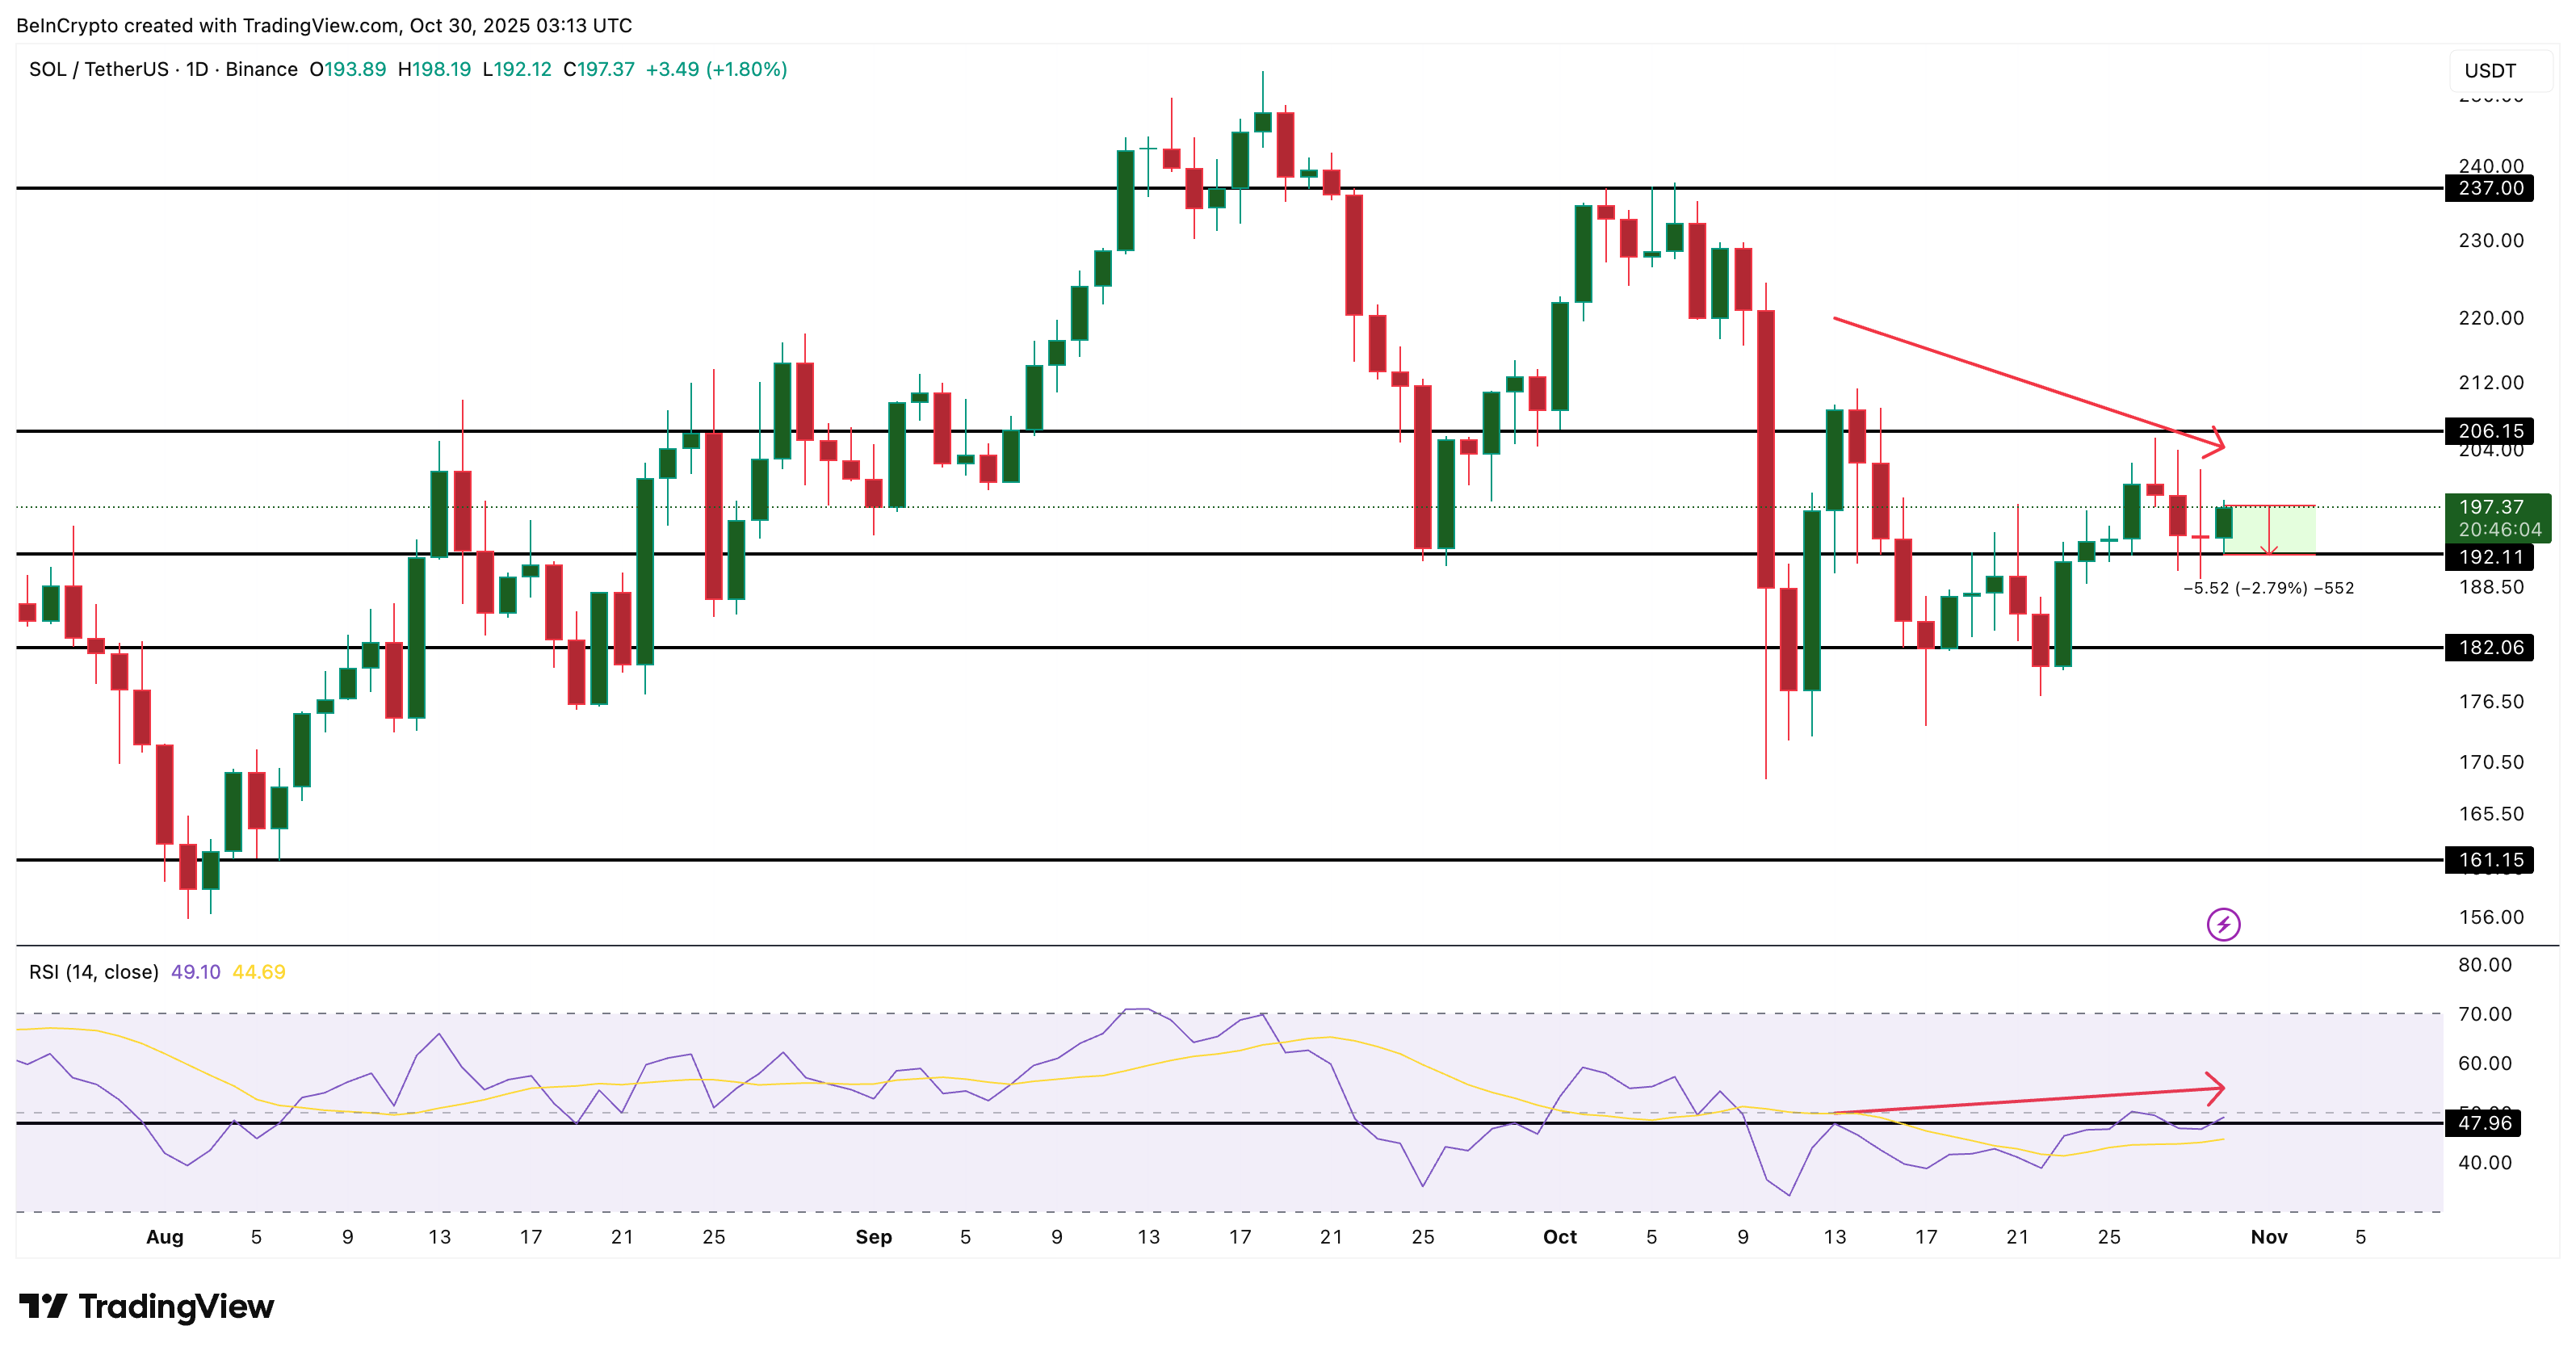
The only way to invalidate this bearish view would be a daily candle close above $206. That could push Solana toward $237. Until then, the structure stays fragile and tilted toward more downside.