

Shiba Inu’s price hasn’t moved much in the past 24 hours. At press time, it was down by just 0.6%, mostly in line with the broader memecoin market decline. But things get worse when one looks at the larger picture.
SHIB has fallen by over 17% in the last 30 days. With that backdrop, bearish signs are starting to appear, and fast. However, there’s one sign of strength that could shift the tone.
Active Addresses Close in on Monthly Lows
The first red flag comes from the network itself. Daily active addresses for SHIB have steadily declined and are now closing in on monthly lows. The metric sits at 3,148, just above the month-on-month bottom of 3,130.
This matters because previous surges in active addresses have always preceded upward price moves. Between August 6 and 8, the count jumped, and the SHIB price responded almost immediately.
While minor on paper, this drop in activity aligns with bearish behavior. The Bull-Bear Power (BBP) indicator shows rising selling pressure, indicating that bears are slowly taking control of the Shiba Inu price momentum.
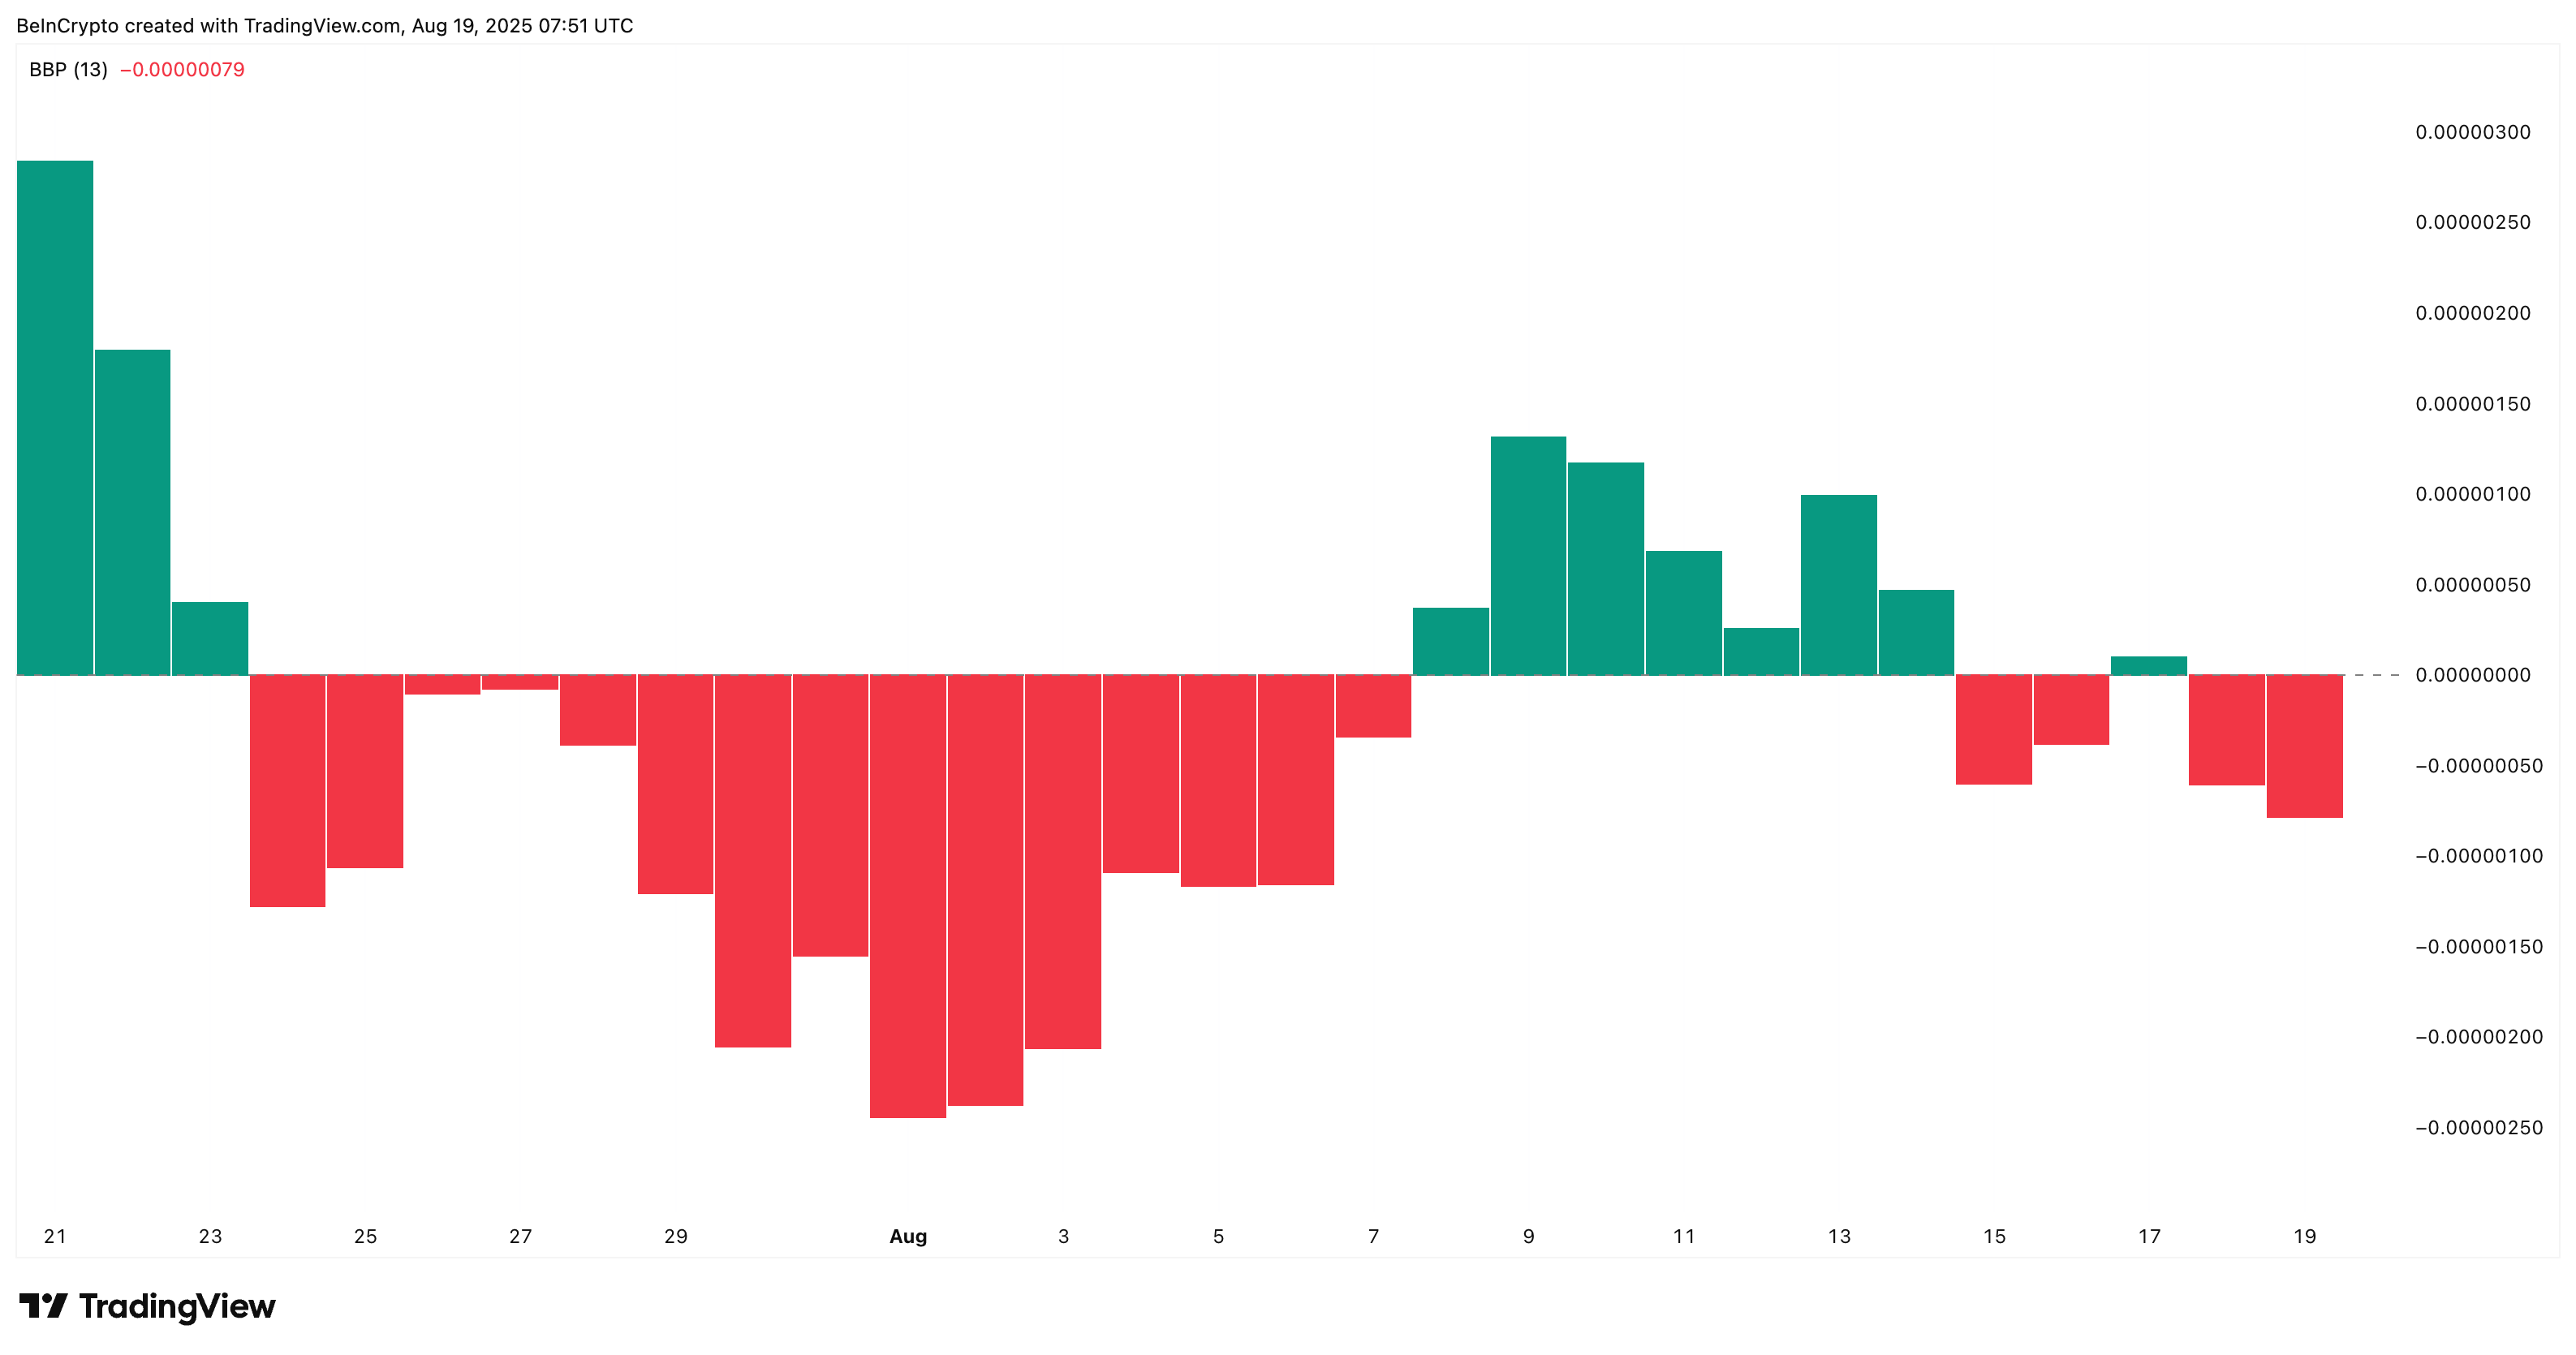
The Bull-Bear Power (BBP) indicator measures the difference between the daily high/low and a moving average to gauge whether bulls or bears are currently in control of price action.
For token TA and market updates: Want more token insights like this? Sign up for Editor Harsh Notariya’s Daily Crypto Newsletter here.
One Key Buyer May Be Holding Up the Floor
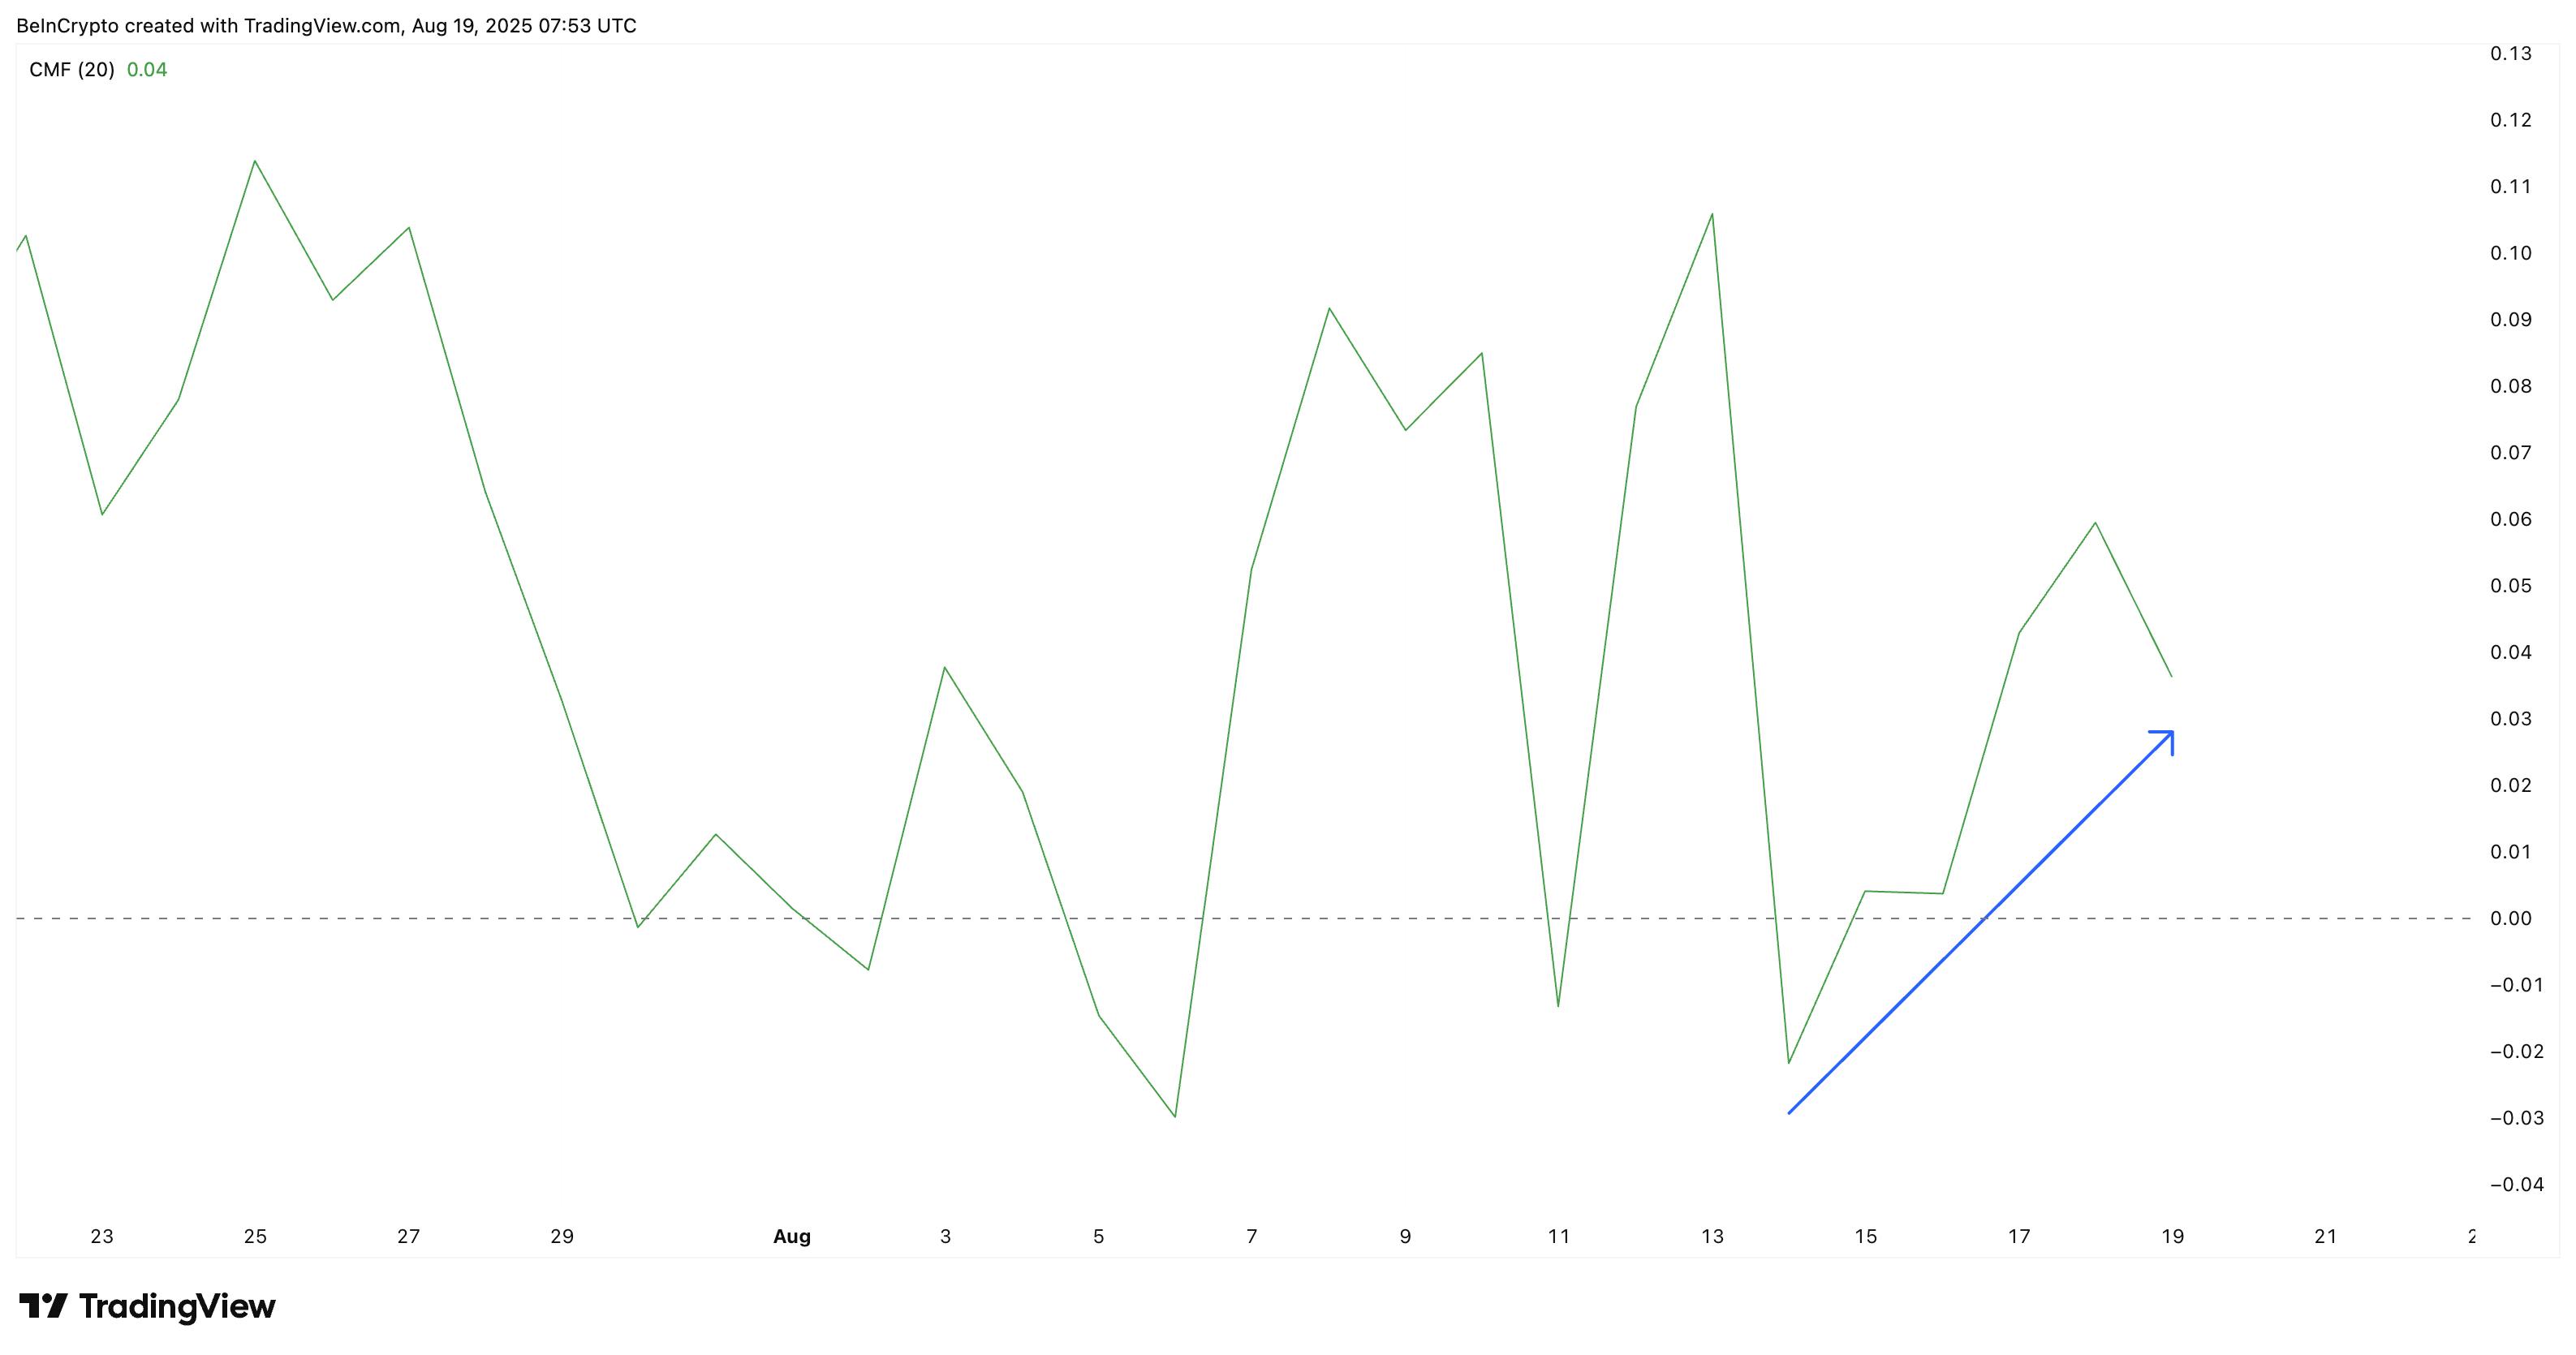
Despite the weak activity and rising bearish momentum, one metric is not falling in line. The Chaikin Money Flow (CMF) is still above the 0 line, indicating net positive capital flow into SHIB. That usually happens when significant players are buying while others exit.
From a technical perspective, CMF making higher lows does mean increased money inflows into the given asset.
Looking deeper, this lines up with the top 100 wallet behavior. These wallets have accumulated trillions of SHIB recently, almost 21 trillion SHIB over 90 days.

So while Smart Money and whales have trimmed positions, the top 100 addresses have been adding way more. The CMF uptick likely reflects these inflows.
The CMF shows buying or selling pressure by combining price and volume; values above zero indicate accumulation, while values below zero suggest distribution.
Bearish Crossover Points to Further Downside For The Shiba Inu Price
The SHIB chart has a clear technical warning printed on it. On the daily time frame, the 20-day EMA (exponential moving average) or the red line has crossed below the 50-day EMA (orange line). Sharp corrections generally follow this bearish crossover.
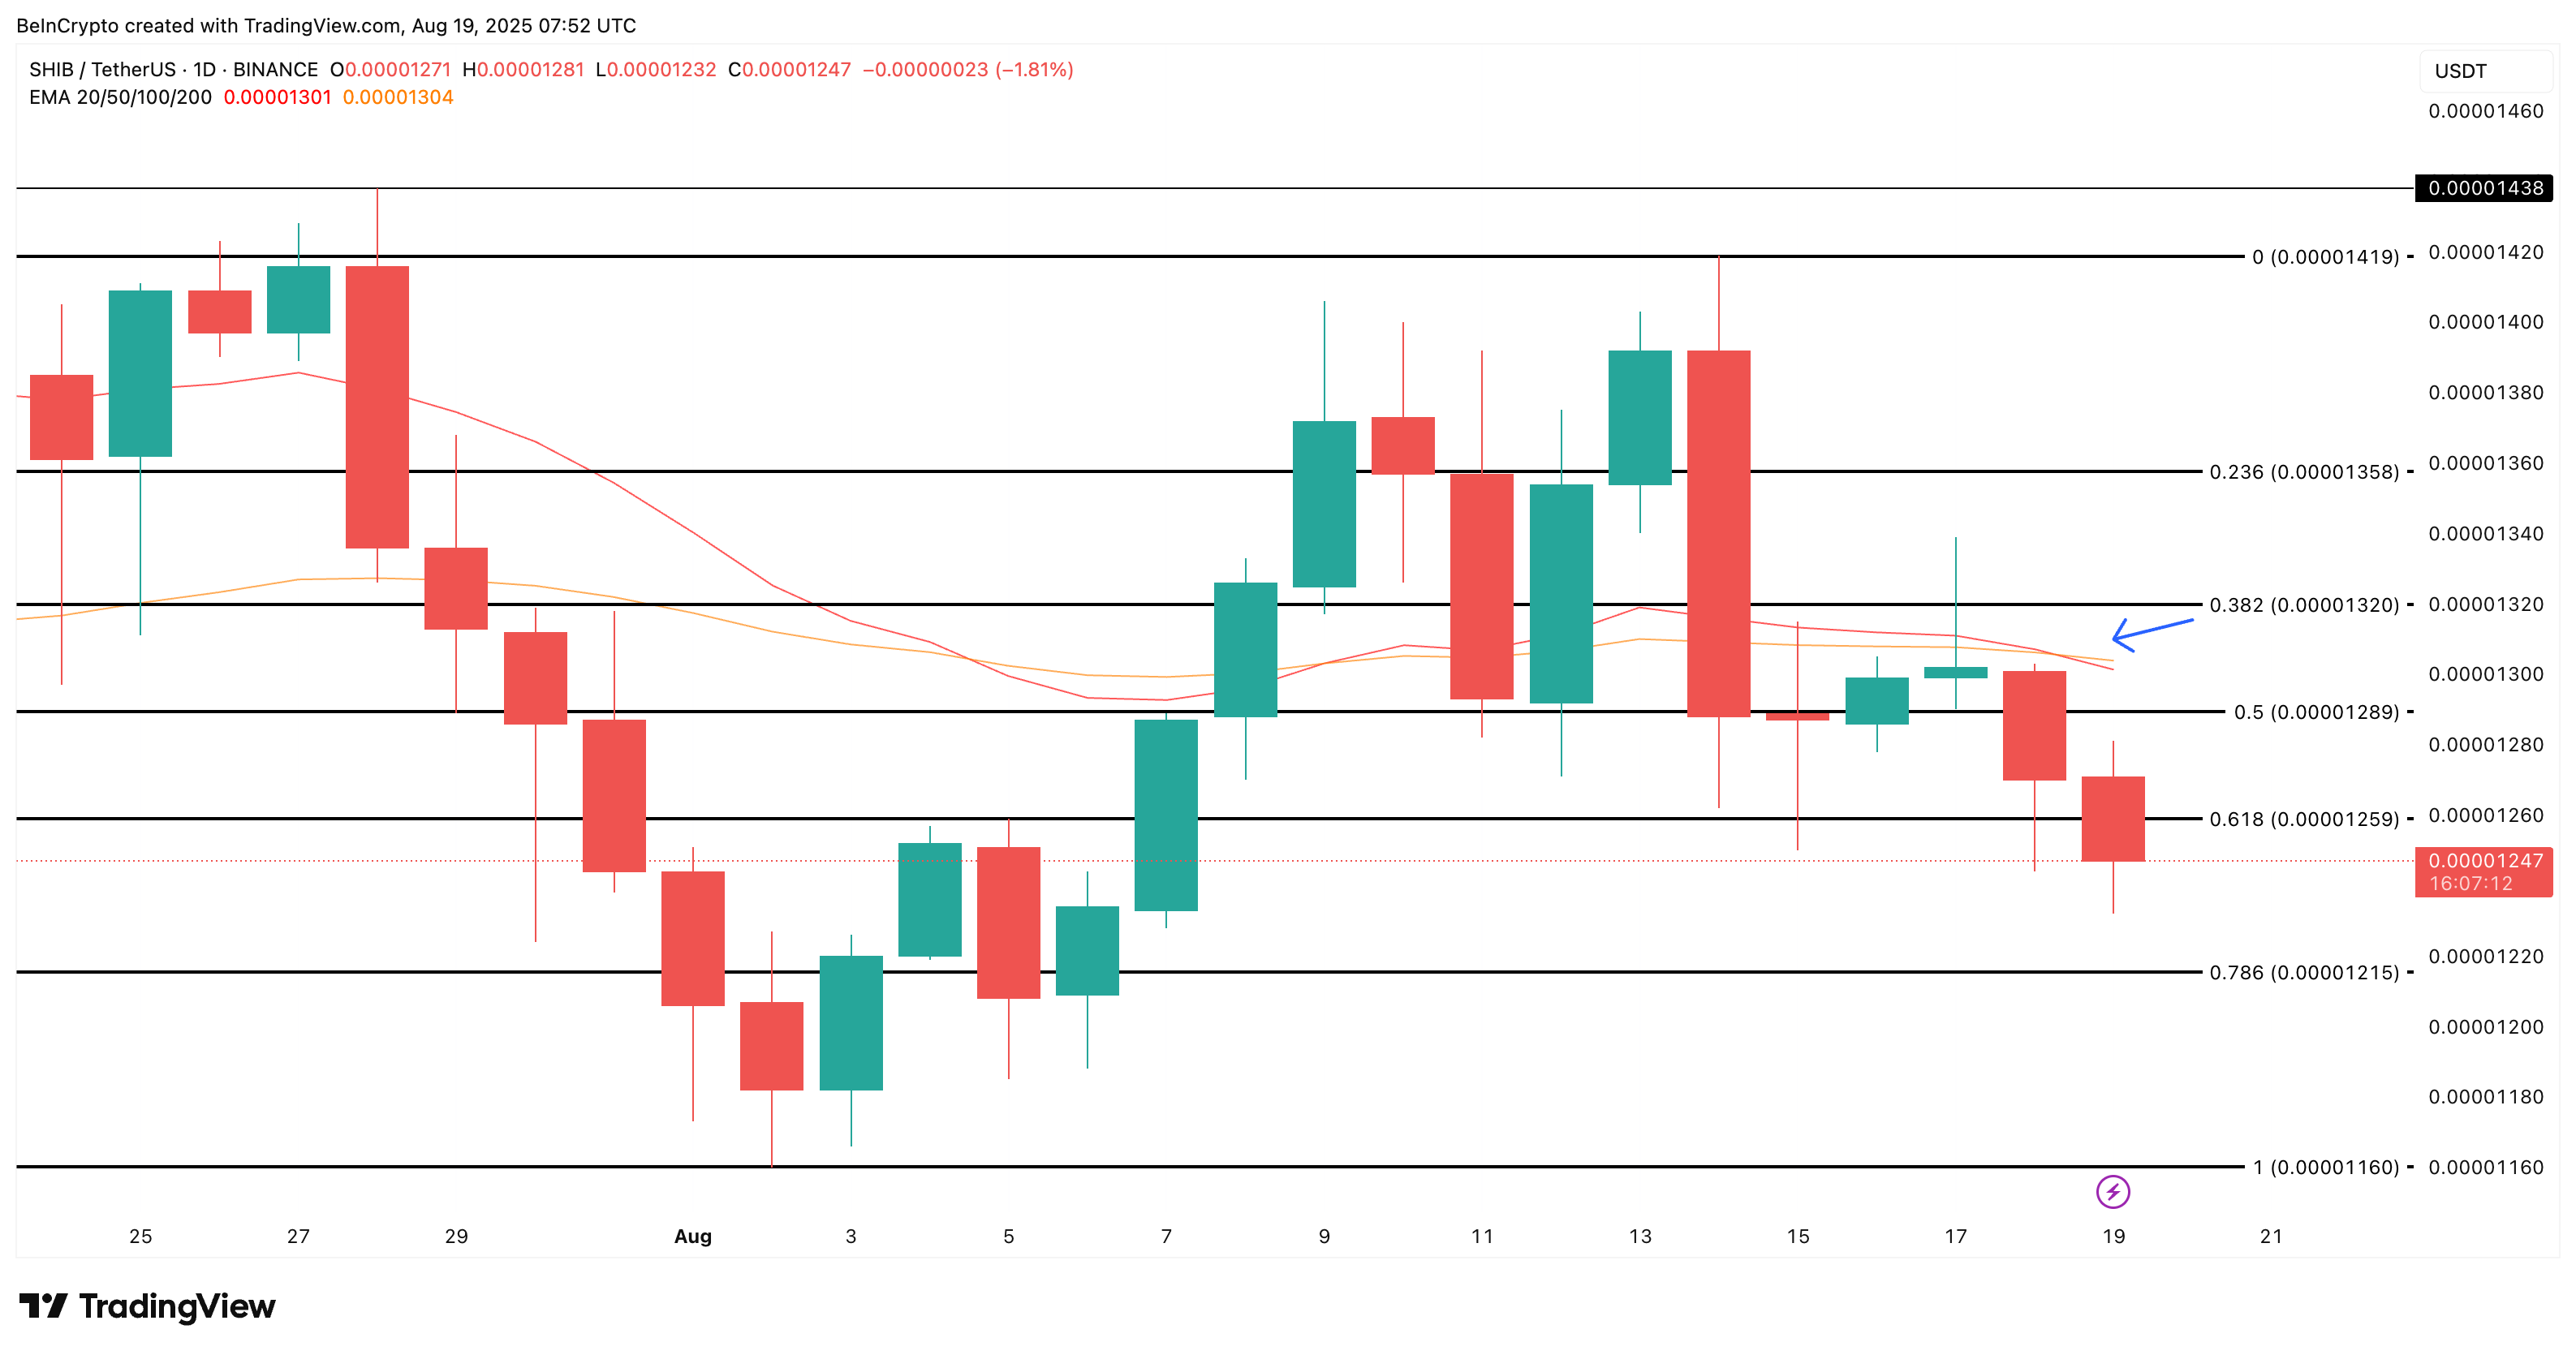
At the same time, the price has broken below the 0.00001259 support level and is currently trading near 0.00001247. If the selling continues, the next price floor appears around 0.00001215. If that breaks, 0.00001160 becomes a likely target, marking a potential deepening of the 30-day correction.
Only a clean break above 0.00001320 would invalidate this bearish outlook. That level would flip the EMAs and restore short-term momentum, but until then, downside risks remain dominant.
The post Shiba Inu Price Slips on Bearish Grounds, But Top Wallets Signal a Twist appeared first on BeInCrypto.