


Pi Network (PI) is showing signs of stabilization after a turbulent month, gaining 4.7% over the past seven days. However, it’s still working to recover from a sharp 31.5% correction over the last 30 days.
While some technical indicators like the DMI suggest rising trend strength, others—such as the CMF and EMA alignment—still point to lingering bearish pressure. With buyers and sellers currently in a tug-of-war, PI’s next move will likely hinge on whether key support or resistance levels give way first.
PI DMI Shows Rising Trend Strength, but Momentum Cools
PI’s Directional Movement Index (DMI) shows that its ADX (Average Directional Index) has risen to 17.17, up from 12.24 just yesterday.
This increase signals that trend strength is starting to build, although it’s still below the key 20 threshold often used to identify the beginning of a strong trend.
The ADX doesn’t show direction—just the strength of the current trend—so a rising ADX, even at lower levels, is typically a sign that market momentum may be picking up.
Looking deeper into the DMI components, the +DI (Positive Directional Indicator) is currently at 25.36, up from 18.22 yesterday, though it has cooled off from a high of 33.2 just hours ago. Meanwhile, the -DI (Negative Directional Indicator) is at 18.55, down from 21.89 yesterday but slightly higher than the earlier low of 12.89.
This shift suggests bullish pressure is still dominant, but some of that buying momentum has faded recently, while sellers are attempting to re-enter. If +DI stays above -DI and ADX continues rising, PI could resume its upward move.
However, if the trend weakens and -DI climbs further, the price may enter a choppy or corrective phase.
Pi Network CMF Slips Back Below Zero, Signaling Caution
Pi Network’s Chaikin Money Flow (CMF) is currently at -0.06, after recovering from -0.09 to neutral (0) earlier today and dipping again in the past few hours.
This intraday reversal may indicate weakening buying pressure after a brief surge in accumulation.
The CMF measures the flow of money into and out of an asset over a given period, combining price and volume data to assess whether buyers or sellers are in control.
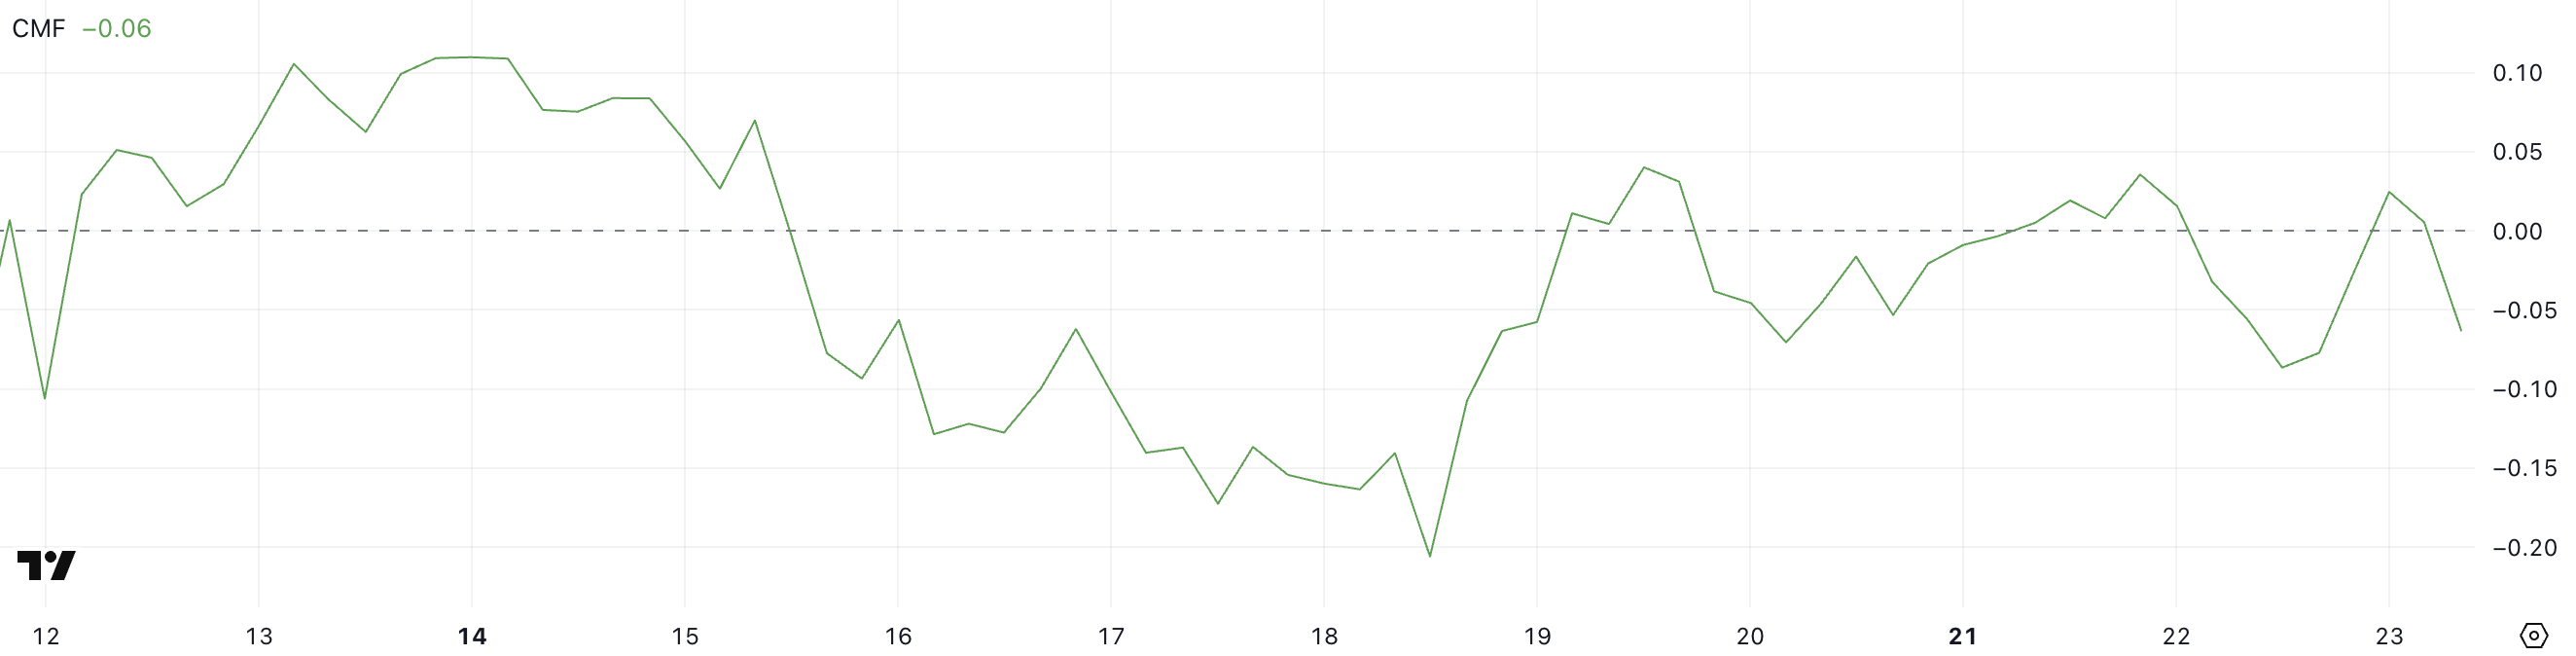
A CMF value above 0 typically suggests buying pressure, while a value below 0 points to selling pressure. With PI’s CMF at -0.06, the current reading leans slightly bearish, indicating that sellers are currently exerting more influence than buyers.
The failed push into positive territory, followed by a dip, may reflect hesitation from bulls and the potential for short-term price weakness.
However, if CMF stabilizes and turns positive again, it could support a continuation of upward momentum.
PI EMA Lines Still Bearish as Key Supports Come Into Play
Pi Network’s exponential moving average (EMA) lines remain in a bearish alignment, with short-term averages still positioned below the longer-term ones.
This setup typically reflects ongoing downward pressure and a lack of strong bullish momentum. If the support at $0.617 is tested and fails to hold, PI price could slide to $0.59.
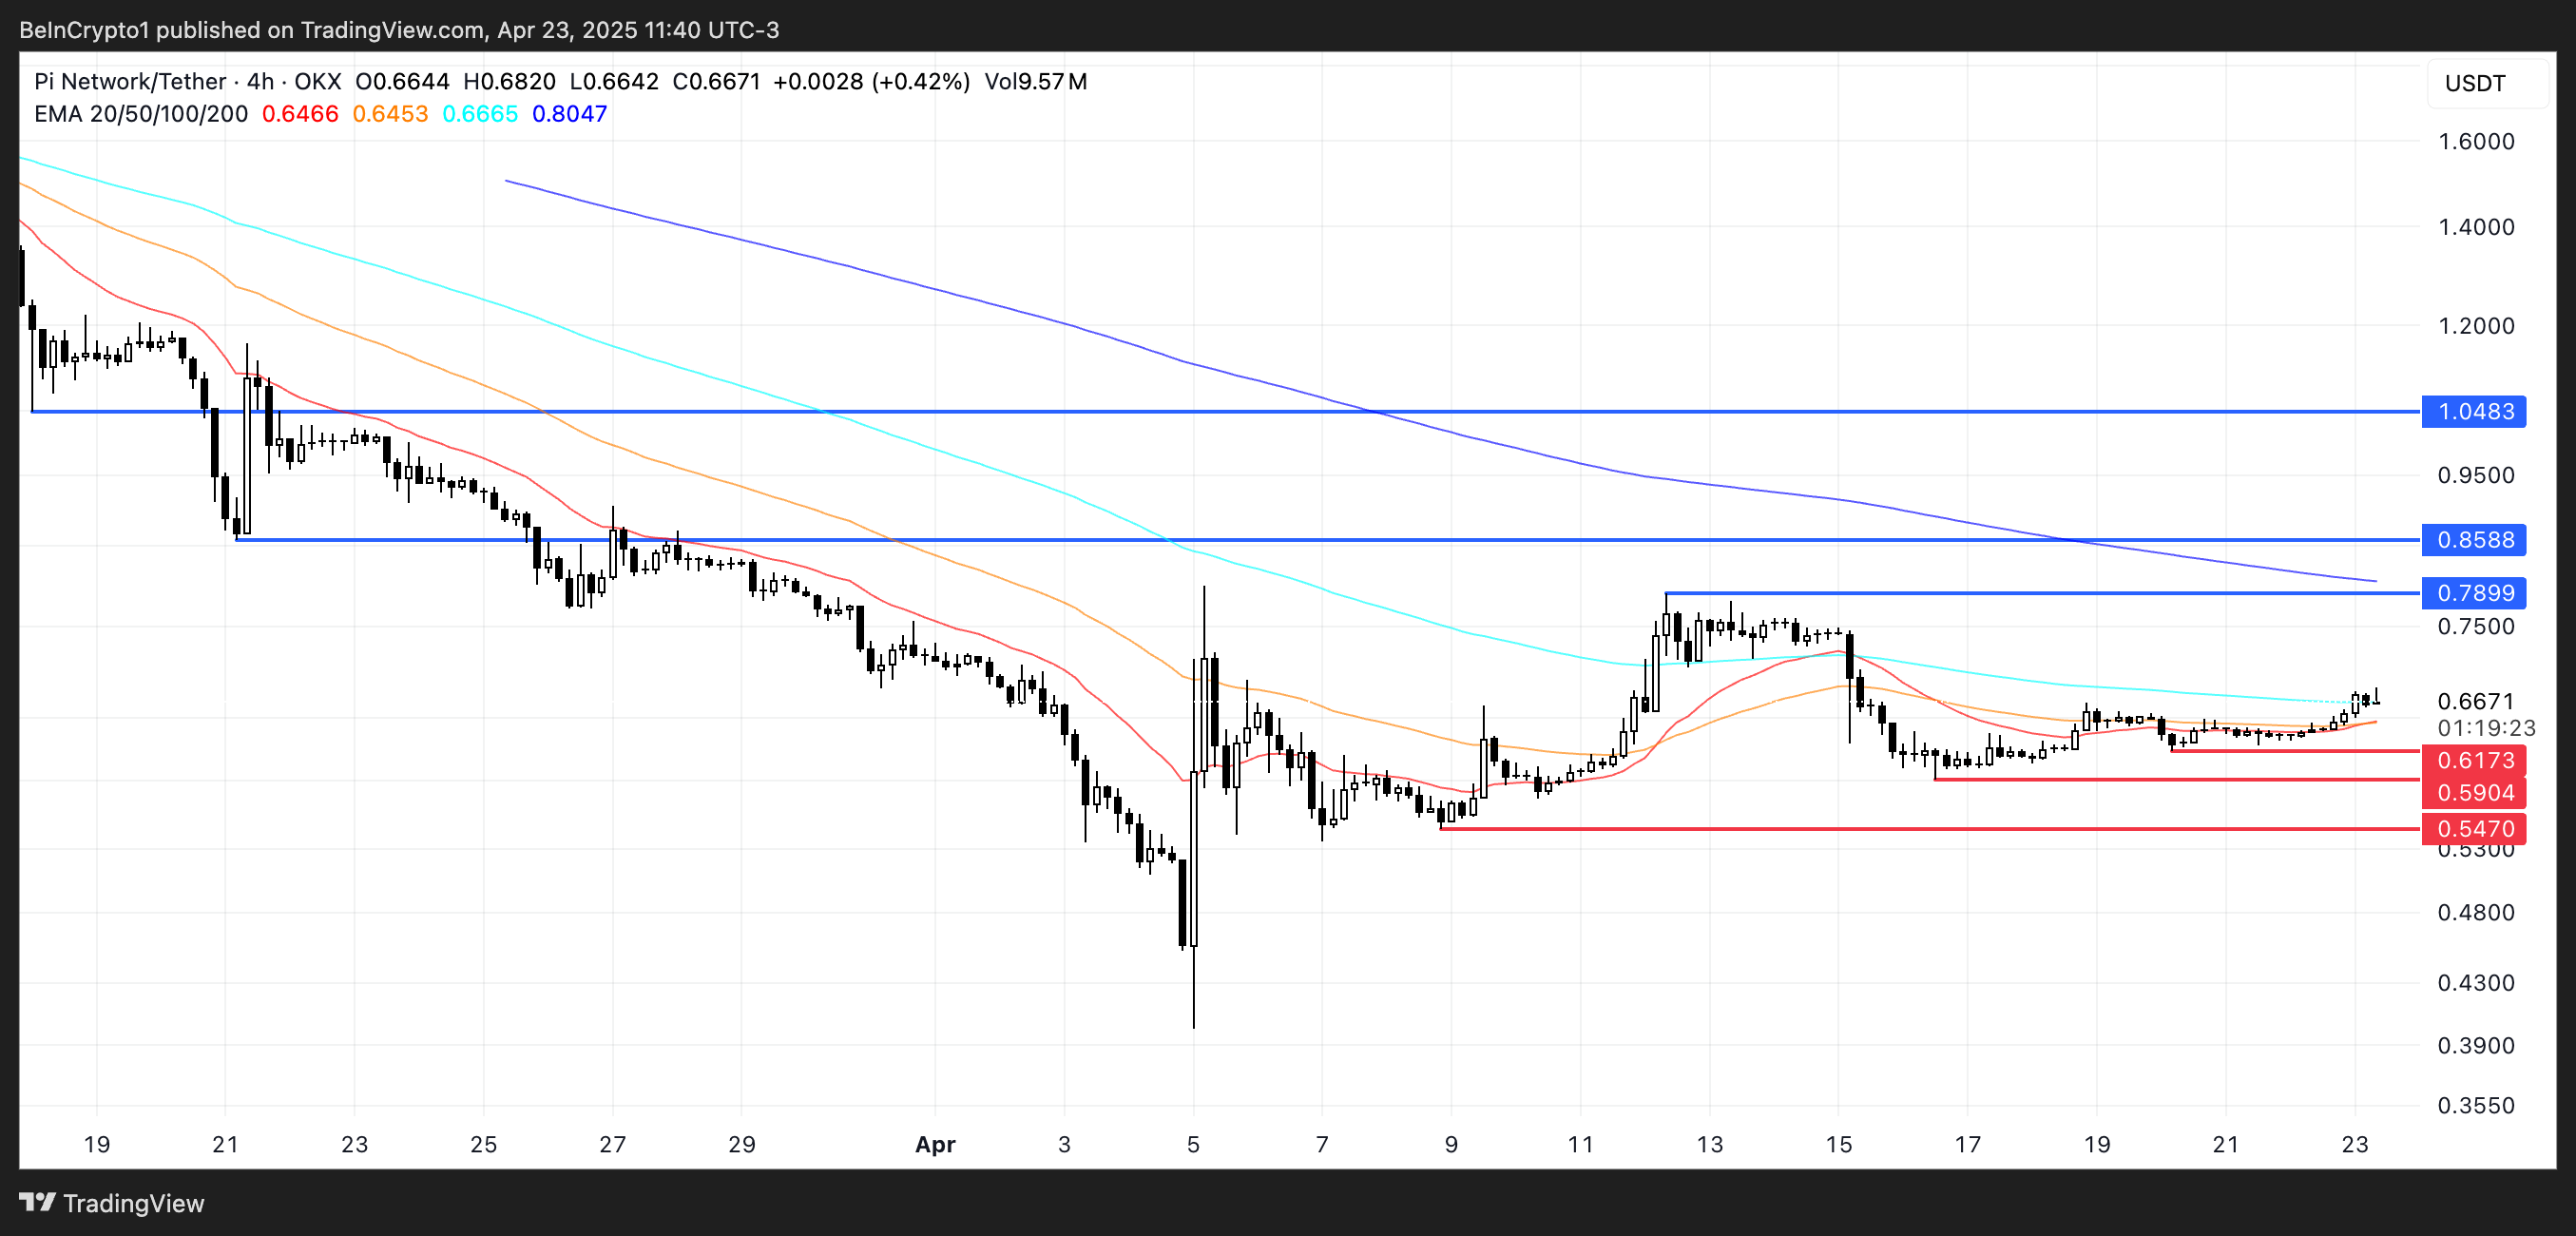
Should that level break as well and the downtrend gain strength, the next key support is at $0.547 — a level that could act as a deeper floor if selling continues.
On the upside, a reversal and the formation of a sustainable uptrend could change the outlook. If PI can gain enough strength to test and break the resistance at $0.789, the next upside target would be $0.85.
A confirmed breakout beyond that could open the path toward $1.04, which would mark the first time the price trades above $1 since March 23.
Disclaimer
In line with the Trust Project guidelines, this price analysis article is for informational purposes only and should not be considered financial or investment advice. BeInCrypto is committed to accurate, unbiased reporting, but market conditions are subject to change without notice. Always conduct your own research and consult with a professional before making any financial decisions. Please note that our Terms and Conditions, Privacy Policy, and Disclaimers have been updated.