


Zen Theory
Apr 01, 2026 02:26
The core principle of this lesson is “No trend, no divergence.” Chan Theory strictly classifies all market movements into three states: uptrend, downtrend, and consolidation, determined by comparing successive highs and lows — both rising simultaneously signals an uptrend, both falling signals a downtrend, and a mismatch between them indicates consolidation. Divergence analysis is only meaningful after a clear trend (uptrend or downtrend) has been confirmed; within consolidation, only consolidation-type divergence exists, not trend-based divergence. All analysis must be grounded in a specific chart timeframe, since the same price action can appear as entirely different states across different levels. The validity of highs and lows must be filtered through a moving average system — only those occurring around moving average interactions (convergence, contact, or entanglement of short-term and long-term MAs) carry analytical significance at that level. Traders should choose chart timeframes that match their capital size, temperament, and trading style, and build a coherent trading system accordingly.
I. Beyond the Retail-vs.-Institutional Divide
Many market participants are preoccupied with deciphering the intentions of major players — institutional funds, market makers, and so-called manipulators. But the adversarial framing of “retail versus institutions” is merely a surface-level manifestation of deeper, invariant market laws. Certain principles transcend the identity of the participant. Grasp them, and the perceived informational advantage of insiders becomes irrelevant. Stories about market manipulators and how to counter them are entertaining, and we may explore them in future installments — but they are secondary to the structural analysis presented here.
II. The Three Exhaustive States of Price Action
There is one proposition about market behavior that is unconditionally true:
Every segment of price action, regardless of its complexity, can be classified into exactly one of three states: uptrend, downtrend, or consolidation (range-bound movement).
This is the simplest of truths, and it is the only foundation worth building an analytical framework upon. No participant — whether a hedge fund, a market maker, or an individual trader — can generate price action that falls outside these three categories. Yet many analysts overlook this foundational simplicity in favor of elaborate, often unfalsifiable constructs. Everything that follows in this series is built upon this tripartite classification.
III. Rigorous Definitions of Uptrend, Downtrend, and Consolidation
A crucial prerequisite: all judgments about trend state must be made with reference to a specific chart timeframe. What appears as consolidation on a daily chart may resolve into a complete uptrend or downtrend on a 30-minute chart, and vice versa. The choice of timeframe is therefore the bedrock of all analysis, and it should be consistent with one’s trading system — determined by capital size, temperament, and operational style.
With a timeframe selected, the three states are defined as follows:
Uptrend: The most recent swing high is higher than the preceding swing high, AND the most recent swing low is higher than the preceding swing low.
Downtrend: The most recent swing high is lower than the preceding swing high, AND the most recent swing low is lower than the preceding swing low.
Consolidation: The most recent swing high is higher than the preceding swing high, BUT the most recent swing low is lower than the preceding swing low; OR the most recent swing high is lower than the preceding swing high, BUT the most recent swing low is higher than the preceding swing low.
In plain language: an uptrend is the synchronized elevation of both highs and lows; a downtrend is their synchronized depression; and consolidation is any configuration where highs and lows move in opposing directions, creating an overlapping, range-bound structure.
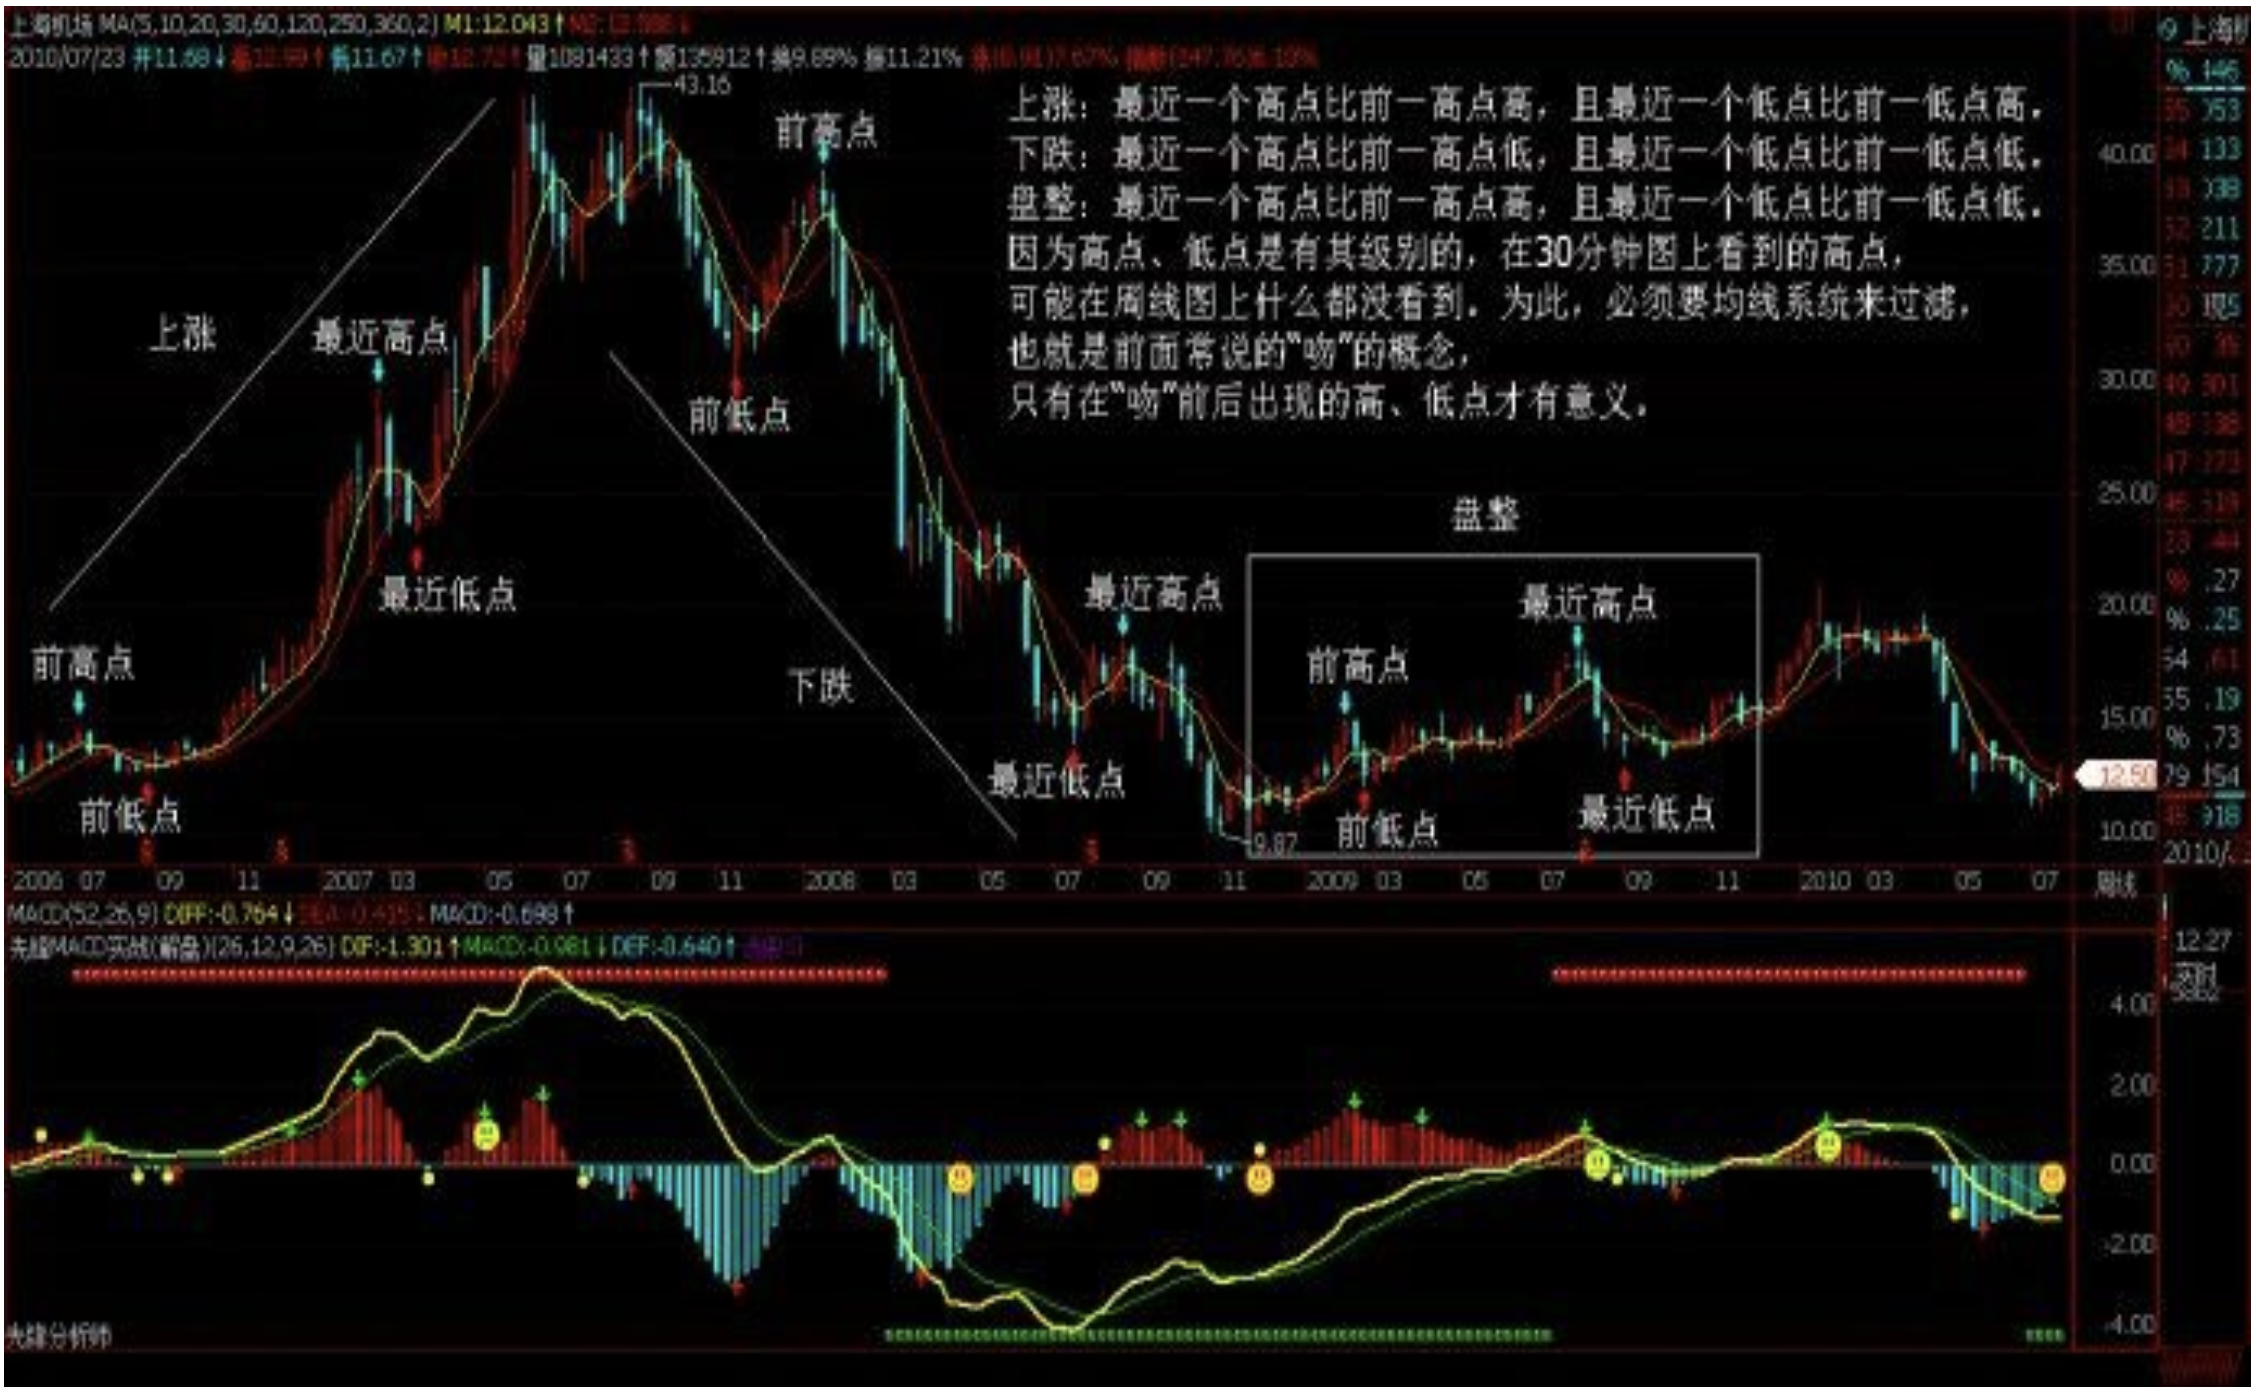
Image description: This is a weekly candlestick chart of Shanghai Airport , spanning approximately July 2006 to July 2010, with multiple moving averages overlaid and the MACD (52, 26, 9) indicator displayed below. The chart is annotated to illustrate the three states of price action using the actual price history. The uptrend phase (mid-2006 through late 2007) labels “Previous High” , “Recent High” , “Previous Low” , and “Recent Low” , showing both highs and lows rising in tandem; the peak is marked at 43.16. The downtrend phase (early 2008 through late 2008) carries identical labels showing both highs and lows declining in sequence, with the trough marked at 9.87. The consolidation phase (early 2009 through early 2010) is enclosed in a gray rectangle, with labels demonstrating the characteristic dislocation — highs and lows moving in opposite directions. Text annotations in the upper right restate the formal definitions and emphasize two key points: (1) swing highs and lows are timeframe-dependent — a high visible on a 30-minute chart may be invisible on a weekly chart; and (2) a moving average system must be used to filter for swing points that are meaningful at the operative timeframe level — only highs and lows that occur in the vicinity of an MA interaction carry analytical significance.
IV. Filtering for Meaningful Swing Points: MA Interactions as the Gatekeeping Mechanism
The definitions themselves are not operationally difficult. The real challenge lies in correctly identifying swing highs and lows that are significant at the chosen timeframe level.
As established in prior installments, swing points have an inherent scale. A swing high that is clearly defined on a 30-minute chart may be completely invisible on a weekly chart. A filtering mechanism is therefore necessary, and the tool for this purpose is the moving average interaction — the approach, contact, or entanglement between the short-term and long-term moving averages discussed in previous articles. Only swing highs and lows that occur in the vicinity of such interactions carry significance at the operative timeframe level.
How do MA interactions arise?
If a price move fails to even breach the short-term MA, then any swing points formed during that move belong to a lower timeframe and are irrelevant at the current level. Based on the degree of challenge posed to the prevailing trend, MA interactions are classified into three types:
Glancing contact (minimal challenge): Price breaches the short-term MA but comes nowhere near the long-term MA before resuming in the original trend direction. The prevailing trend faces essentially no resistance.
Brief contact (limited challenge): Price breaches the long-term MA but immediately forms a trap, snapping back to the other side. Though the long-term MA was momentarily penetrated, the counter-move lacked sufficient force to alter the trend.
Entanglement (substantive challenge): Price breaches the long-term MA and proceeds to weave back and forth around it in a prolonged interaction. This indicates that the counter-force has achieved meaningful intensity. Virtually all trend reversals begin with an entanglement.
V. Two Basic Modes of Trend Reversal
Trend reversals generally take one of two forms:
Mode 1: Post-entanglement trap and reversal. After a full entanglement, price continues briefly in the original trend direction, creating a false extension (a trap), and then reverses sharply. The primary diagnostic tool for identifying this type of reversal is divergence.
Mode 2: Reversal via consolidation. Price enters a sideways range and gradually exhausts the energy of the prior trend, effecting a direction change through the passage of time rather than an abrupt reversal. This mode will be discussed in detail in a future installment.
VI. The Core Thesis: No Trend, No Divergence
One principle must be stated with absolute clarity:
Divergence exists only within trends. In consolidation, the concept of divergence does not apply.
Divergence, by definition, is the weakening of trend momentum. It is meaningful only when a directional trend is in progress — when successive waves of price movement can be compared in terms of force. In a consolidation range, price action lacks sustained directionality, and there is no sequential momentum to compare. Attempting to apply divergence analysis within a consolidation range is a categorical error.
Additionally, it bears repeating: all judgments described here involve only two moving averages and price action itself. No technical indicators are required. Indicators may serve as supplementary references, but they are not the basis for any determination.
VII. How to Identify Divergence
To make divergence identification precise, a formal concept is introduced:
Trend Impulse Strength: The area enclosed between the short-term MA and the long-term MA, measured from the end of one MA interaction to the beginning of the next.
When two consecutive impulses move in the same direction, and the second impulse’s Trend Impulse Strength is weaker than the first (i.e., the enclosed area is smaller), divergence is confirmed.
This is the most reliable method, but it has one drawback: confirmation can only occur after the subsequent MA interaction has begun, by which point the price has already moved some distance from the actual turning point.
How can this lag be mitigated?
Method 1: Drop to a lower timeframe. Examine the next lower timeframe’s chart and apply the same methodology to identify the corresponding turning point. Because signals appear earlier on shorter timeframes, the identified point will be much closer to the true extreme.
Method 2: Use Average Trend Impulse Strength for real-time assessment (advanced technique).
An additional concept is introduced for this purpose:
Average Trend Impulse Strength: The area enclosed between the short-term MA and the long-term MA from the end of the prior MA interaction to the present moment, divided by elapsed time.
Because this metric is calculated in real time, one can continuously compare the current Average Trend Impulse Strength against that of the preceding impulse. The moment the current reading falls below the prior one, divergence is assessed as imminent. From that point, monitor the distance between the short-term MA and the long-term MA: once this gap begins to narrow, the true extreme is forming.
This method can capture turning points virtually in real time. The trade-off is marginally higher risk, greater technical skill requirements, and the need for a well-developed intuitive feel for market rhythm.
VIII. Two Moving Averages Are Sufficient
In the final analysis, a candlestick chart overlaid with just two moving averages provides all the information needed to navigate even the most complex market conditions. The interaction states of those two averages — glancing contact, brief contact, and entanglement — yield a direct reading of trend momentum. The concepts of Trend Impulse Strength and divergence that follow from these interactions encompass the entirety of the reversal-identification logic.
For those who have not yet developed the ability to read these signals directly from the MA chart, technical indicators such as MACD can serve as training aids. The application of specific technical indicators will be covered in subsequent installments.
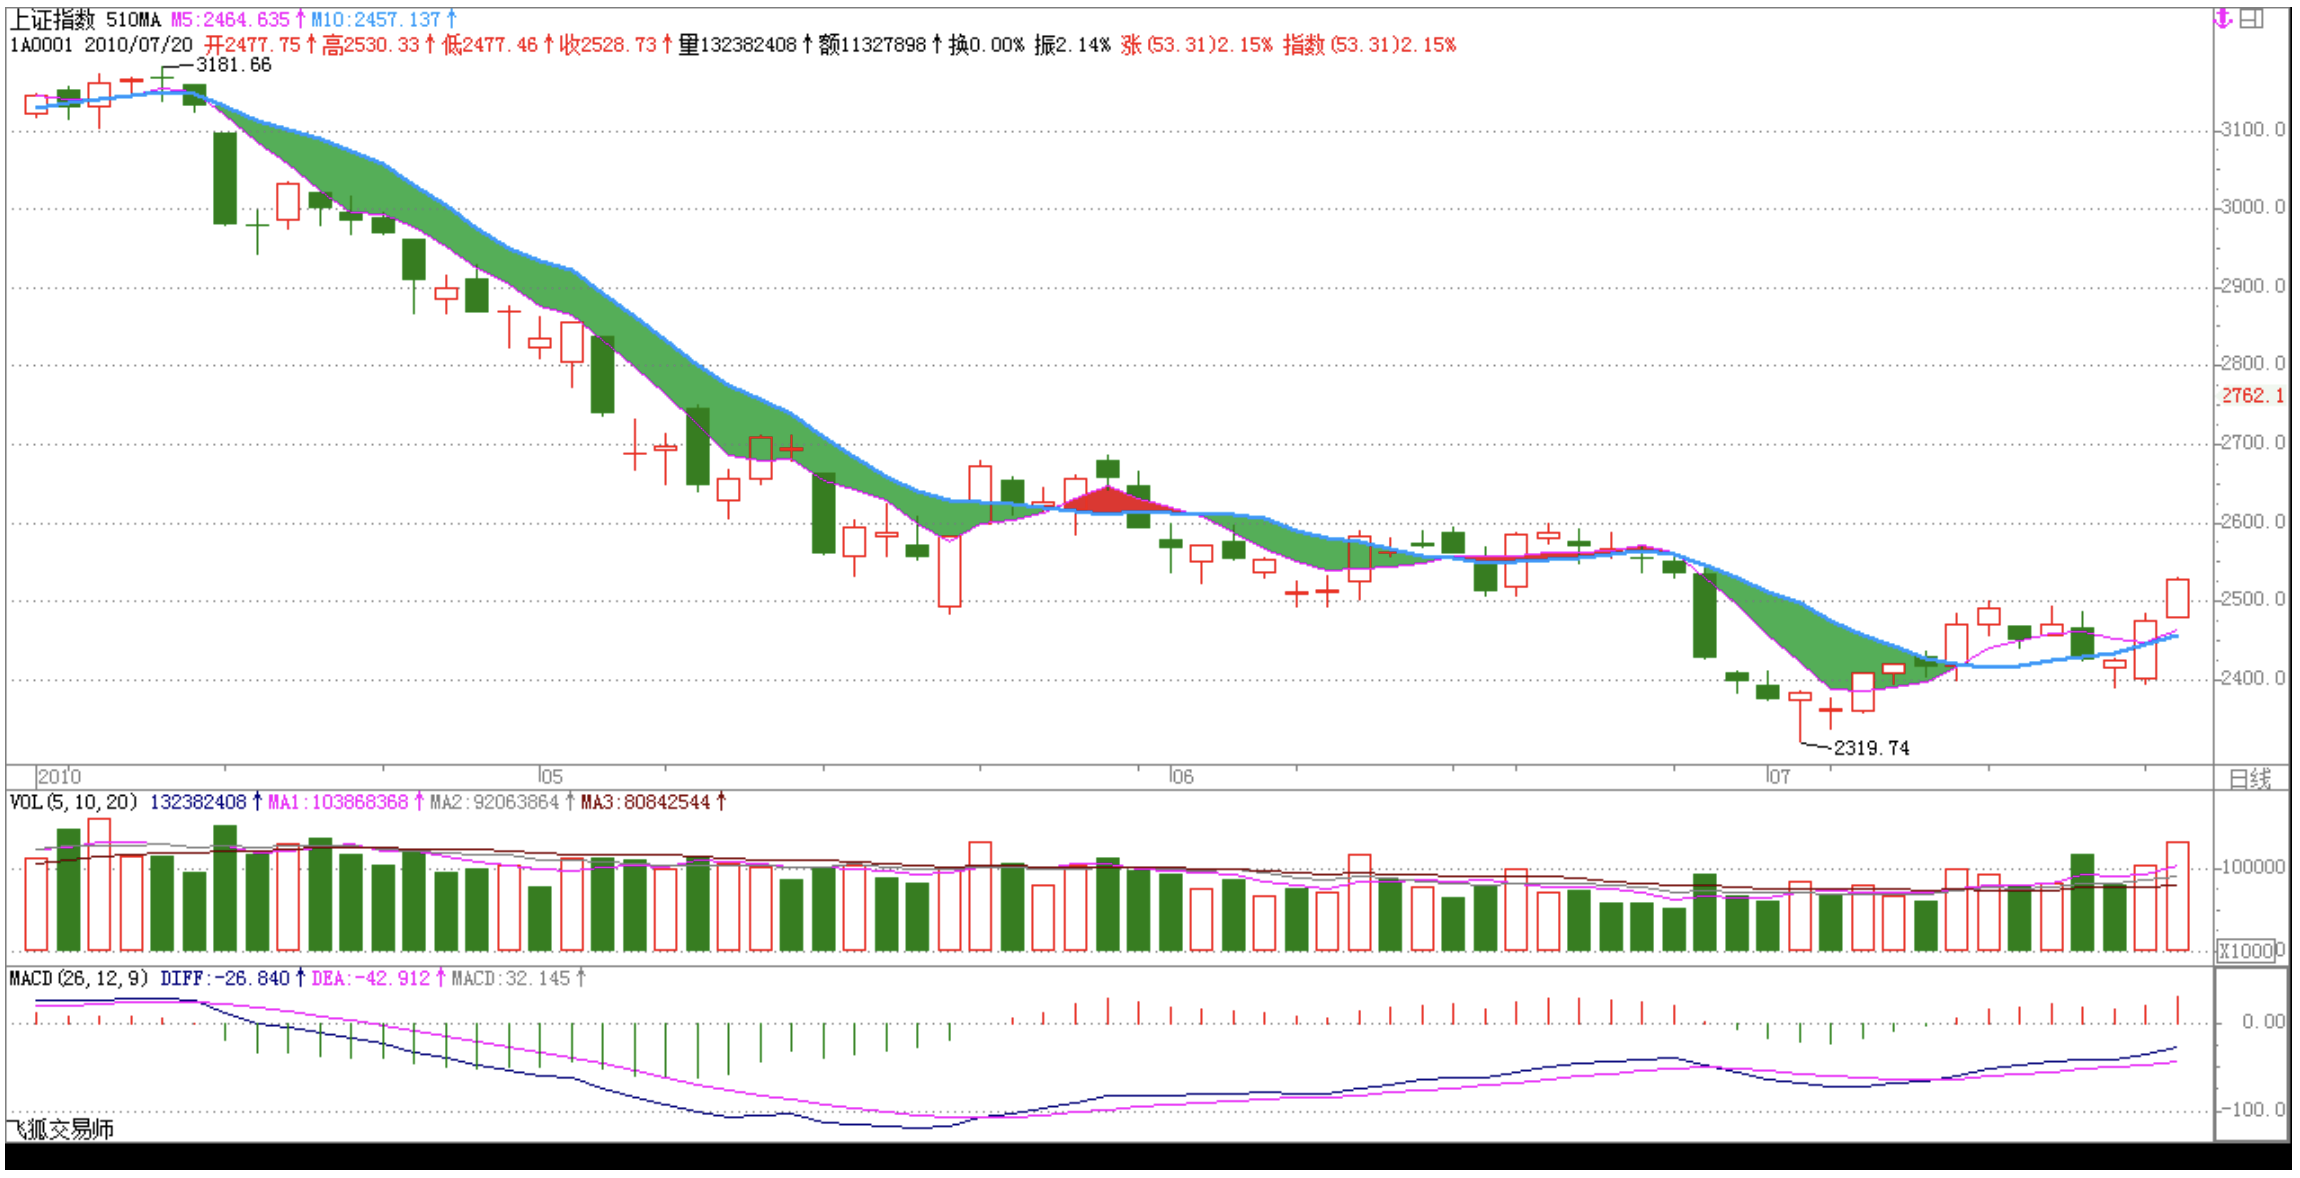
Image description: This is a daily candlestick chart of the Shanghai Composite Index (上证指数, code 1A0001), spanning from early January 2010 to July 20, 2010, generated in the FoxTrader platform. The main panel overlays the 5-day MA (magenta) and 10-day MA (blue), with the area between them filled in green, making the MA spread visually prominent. The index declined from a high of 3181.66 at the start of the year to a low of 2319.74 in early July, with the 5-day MA running consistently below the 10-day MA throughout — a textbook bearish alignment. Each instance where the 5-day MA converged toward or briefly crossed the 10-day MA before re-diverging downward constitutes an MA interaction of varying intensity. The middle panel displays volume bars with 5-, 10-, and 20-day volume MAs. The bottom panel shows the MACD (26, 12, 9) with both the DIFF and DEA lines remaining below the zero axis for the duration of the decline. This chart serves as a standard reference for observing MA interactions and Trend Impulse Strength variations within a sustained bearish alignment.
IX. Summary
The central arguments of this installment are:
All price action decomposes into three states — uptrend, downtrend, and consolidation — defined rigorously by the relative positioning of successive swing highs and swing lows.
Swing points must be filtered by timeframe level. The MA interaction framework (glancing contact, brief contact, entanglement) provides the necessary filter, ensuring that only swing points significant at the operative timeframe are incorporated into the analysis.
Divergence is exclusively a trend phenomenon. It measures the decay of momentum across successive same-direction impulses and has no meaning within consolidation ranges.
Divergence can be identified through the comparison of Trend Impulse Strength across successive impulses, with real-time refinement available via Average Trend Impulse Strength — or by dropping to a lower timeframe to pinpoint the turning point with greater precision.
Two moving averages and price action alone are sufficient for a complete analytical framework. Technical indicators are optional supplements, not requirements.
Image source: Shutterstock