


Hyperliquid price consolidates near $45, backed by strong on-chain data and rising user activity, while volume hints at a possible bullish reversal toward $53.
Summary
$45 acts as major confluence support with Fibonacci, Bollinger Band, and POC alignment.
On-chain metrics show rising cumulative users and daily trades.
Market structure remains bullish, targeting $53 resistance as the next upside objective.
After a brief correction from its recent highs, Hyperliquid price (HYPE) is finding solid footing at the $45 support level. This zone is reinforced by several key technical confluences, including the point of control, the 0.618 Fibonacci retracement, and the lower boundary of the Bollinger Bands.
The convergence of these indicators often marks a region where buyers step in, forming a potential foundation for a reversal. At the same time, on-chain metrics are showing continued growth in user activity, further strengthening the bullish outlook. Adding to the optimism, Hyperliquid has launched its own USDH stablecoin, a move that underscores confidence in its ecosystem and could further boost liquidity and network activity.
Hyperliquid price key technical points
Support Zone: The $45 region aligns with the point of control, the 0.618 Fibonacci retracement, and the lower Bollinger Band.
On-Chain Growth: Cumulative new users and total daily trades on Hyperliquid continue to increase.
Bullish Structure: Market structure remains intact, with a potential higher low forming near $45 to sustain the macro uptrend.
From a technical standpoint, the $45 support region represents an area of high confluence and significance. The alignment of the 0.618 Fibonacci level with the lower Bollinger Band and POC suggests that this is not a random pause in price action, but rather a controlled pullback within an ongoing uptrend. Historically, such confluence zones have acted as springboards for strong recoveries when volume supports the move.
Price action at this level will determine whether Hyperliquid can establish a new higher low, which would confirm the continuation of the broader bullish market structure. If price begins to rotate upward from this zone, it would reaffirm the trend of higher highs and higher lows, signaling that the macro bullish projection remains valid.
Volume data supports this potential reversal. Recent sessions have recorded strong bullish inflows, suggesting active demand at lower price levels. Sustained buying pressure is crucial for validating the recovery move.
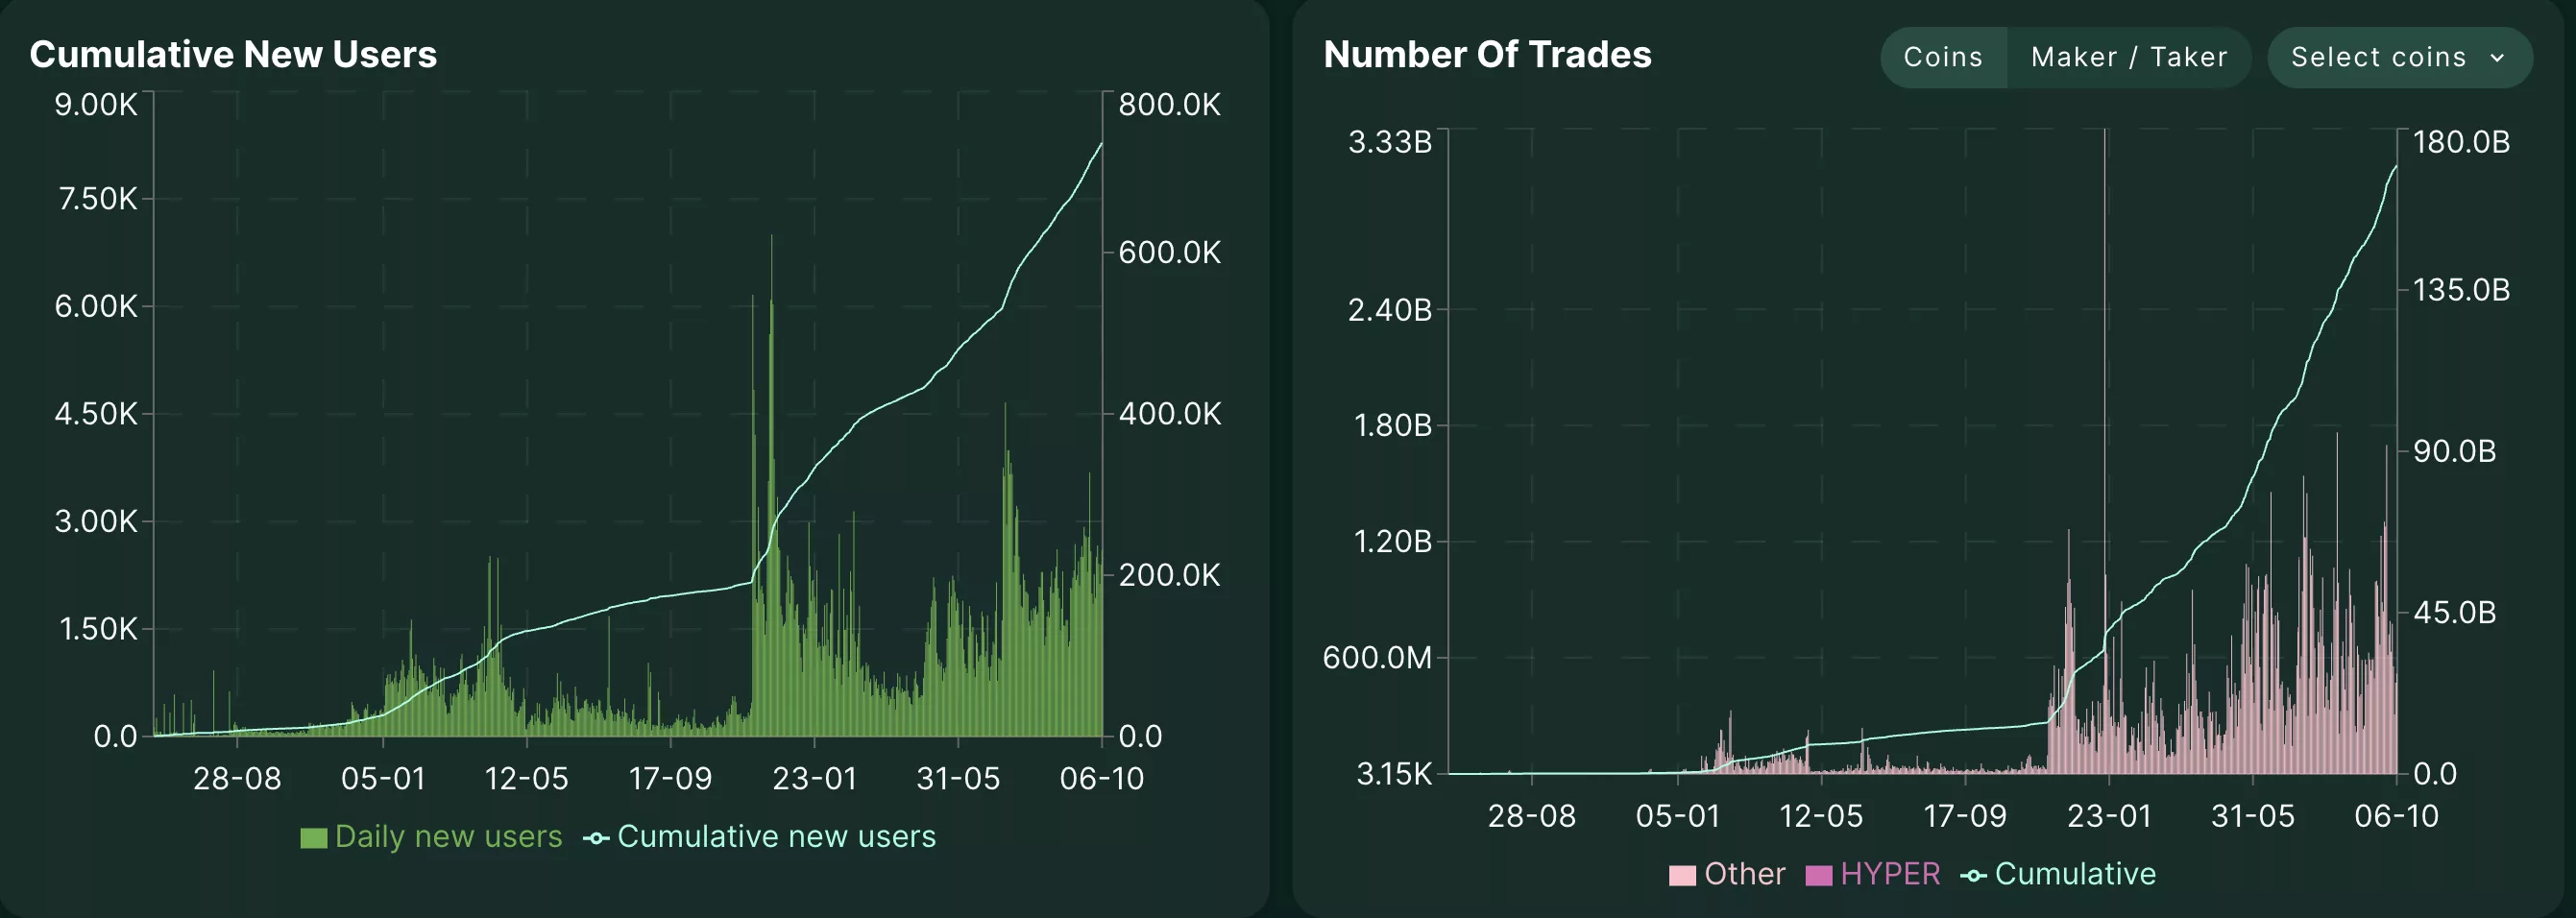
On-chain data provides an additional layer of confirmation. Cumulative new user counts and daily trade numbers are both trending higher, indicating expanding network usage and increased liquidity.
Such behavior is typically observed during phases of accumulation or early-stage bullish reversals. The rise in user activity reflects growing interest in the ecosystem, aligning with the technical signals pointing toward renewed upward movement.
What to expect in the coming price action
If Hyperliquid maintains support around $45 and confirms a higher low formation, a rotation toward the $53 resistance level becomes increasingly likely. A breakout above $53 would open the door for further price discovery, driven by strengthening on-chain fundamentals and sustained trading volume.