

Candlestick charts are a popular tool for traders to visualize price movements and interpret market behavior. Unlike line charts that show only closing prices, candlestick charts provide a complete picture of the trading session, showing the open, high, low, and close prices in a single candle.
These charts help traders determine whether buyers or sellers controlled the market during a session and identify patterns that may signal trend reversals or continuations. Common candlestick patterns range from single-candle formations, such as the hammer or shooting star, to multi-candle patterns, such as the morning star, evening star, and three white soldiers.
In this article, we will explain the components and characteristics of a candlestick, how to read single and multiple candles, explore bullish and bearish patterns, and show how candlestick charts can be used in crypto trading.
What Is a Candlestick Chart?
Candlestick chart is a way to visualize price movement over a specific timeframe. Unlike a simple line chart, each candlestick shows four key points: the open, high, low, and close of that period. This allows traders to see not just the direction of price, but also the strength of buyers and sellers during that window.
Candlestick charts are especially valuable in crypto trading because prices can swing quickly, and emotions often drive short-term volatility. A single candle can reveal whether buyers pushed aggressively, sellers dominated, or the market was indecisive.
By reading these candles, traders can spot potential reversals, continuation patterns, and areas of support or resistance more clearly than they could with simpler chart types. If you’re still getting familiar with crypto basics, understanding what cryptocurrency is can help put the price movements into context.
History of Candlestick Charts
Candlestick charts were first developed in Japan during the 18th century for rice trading. Traders used them to track price behavior and market psychology, documenting how prices opened, moved, and closed within each period. This method enabled the observation of patterns indicating potential shifts in supply and demand.
Western markets adopted candlestick charting much later, and it became a core tool in technical analysis. The strength of candlesticks lies in their ability to show both direction and momentum, giving traders insights into market sentiment.
Components of a Candlestick
The Body: The body of a candlestick shows the distance between the opening and closing price. A long body indicates strong momentum in one direction. A small body shows indecision or weak movement during that period, even if the wicks are long.The Wick: The wick, also called the shadow, shows the highest and lowest prices reached during the timeframe. A long upper shadow signals that buyers pushed the price up but faced selling pressure. A long lower wick shows that sellers initially drove the price lower, but buyers later regained control and lifted it back up.Color: Candlesticks use color to indicate direction. Green (or white) means the close is higher than the open, signaling bullish pressure. Red (or black) means the closing price is less than the opening price, signaling bearish pressure. Color alone does not measure strength; body size and wick length provide more insight.Open, High, Low, Close (OHLC): Every candle is built from four key values: open, high, low, and close. These values together show the complete range of price movement within that timeframe. Traders can assess momentum, rejection levels, and market sentiment using OHLC data.
How to Read a Single Candlestick
A single candlestick provides a snapshot of market behavior within a specific timeframe. It shows whether buyers or sellers controlled the price and how strongly they did so.
A long green candle indicates strong buying momentum, suggesting buyers dominated the session.A long red candle shows heavy selling pressure, meaning sellers were in control.A small body with long upper and lower wicks signals market indecision, in which neither buyers nor sellers gain a clear advantage.
Single candlesticks can hint at reversals or continuation, but one candle alone rarely provides a reliable trading signal. Context matters. The previous trend, key support and resistance levels, and the overall market structure enhance the usefulness of the information.
Candlesticks describe what the price did during that period. Combining them with volume and trend direction helps traders make better-informed decisions and predict the prices of Bitcoin and other cryptocurrencies.
Bullish Candlestick Patterns
1. Hammer
As the name implies, a hammer has a small real body near the top of the candle and a long lower shadow, with little to no upper shadow. This pattern occurs when sellers push the price down during the period, but buyers step in and close the candle near the opening price.
The hammer is most effective after a decline or near a support level, but traders often wait for confirmation from the next candle before entering a trade. A similar pattern to the hammer is the inverted hammer. The inverted hammer has a small body near the bottom, a long upper shadow, and little/no lower wick, like an upside-down hammer.
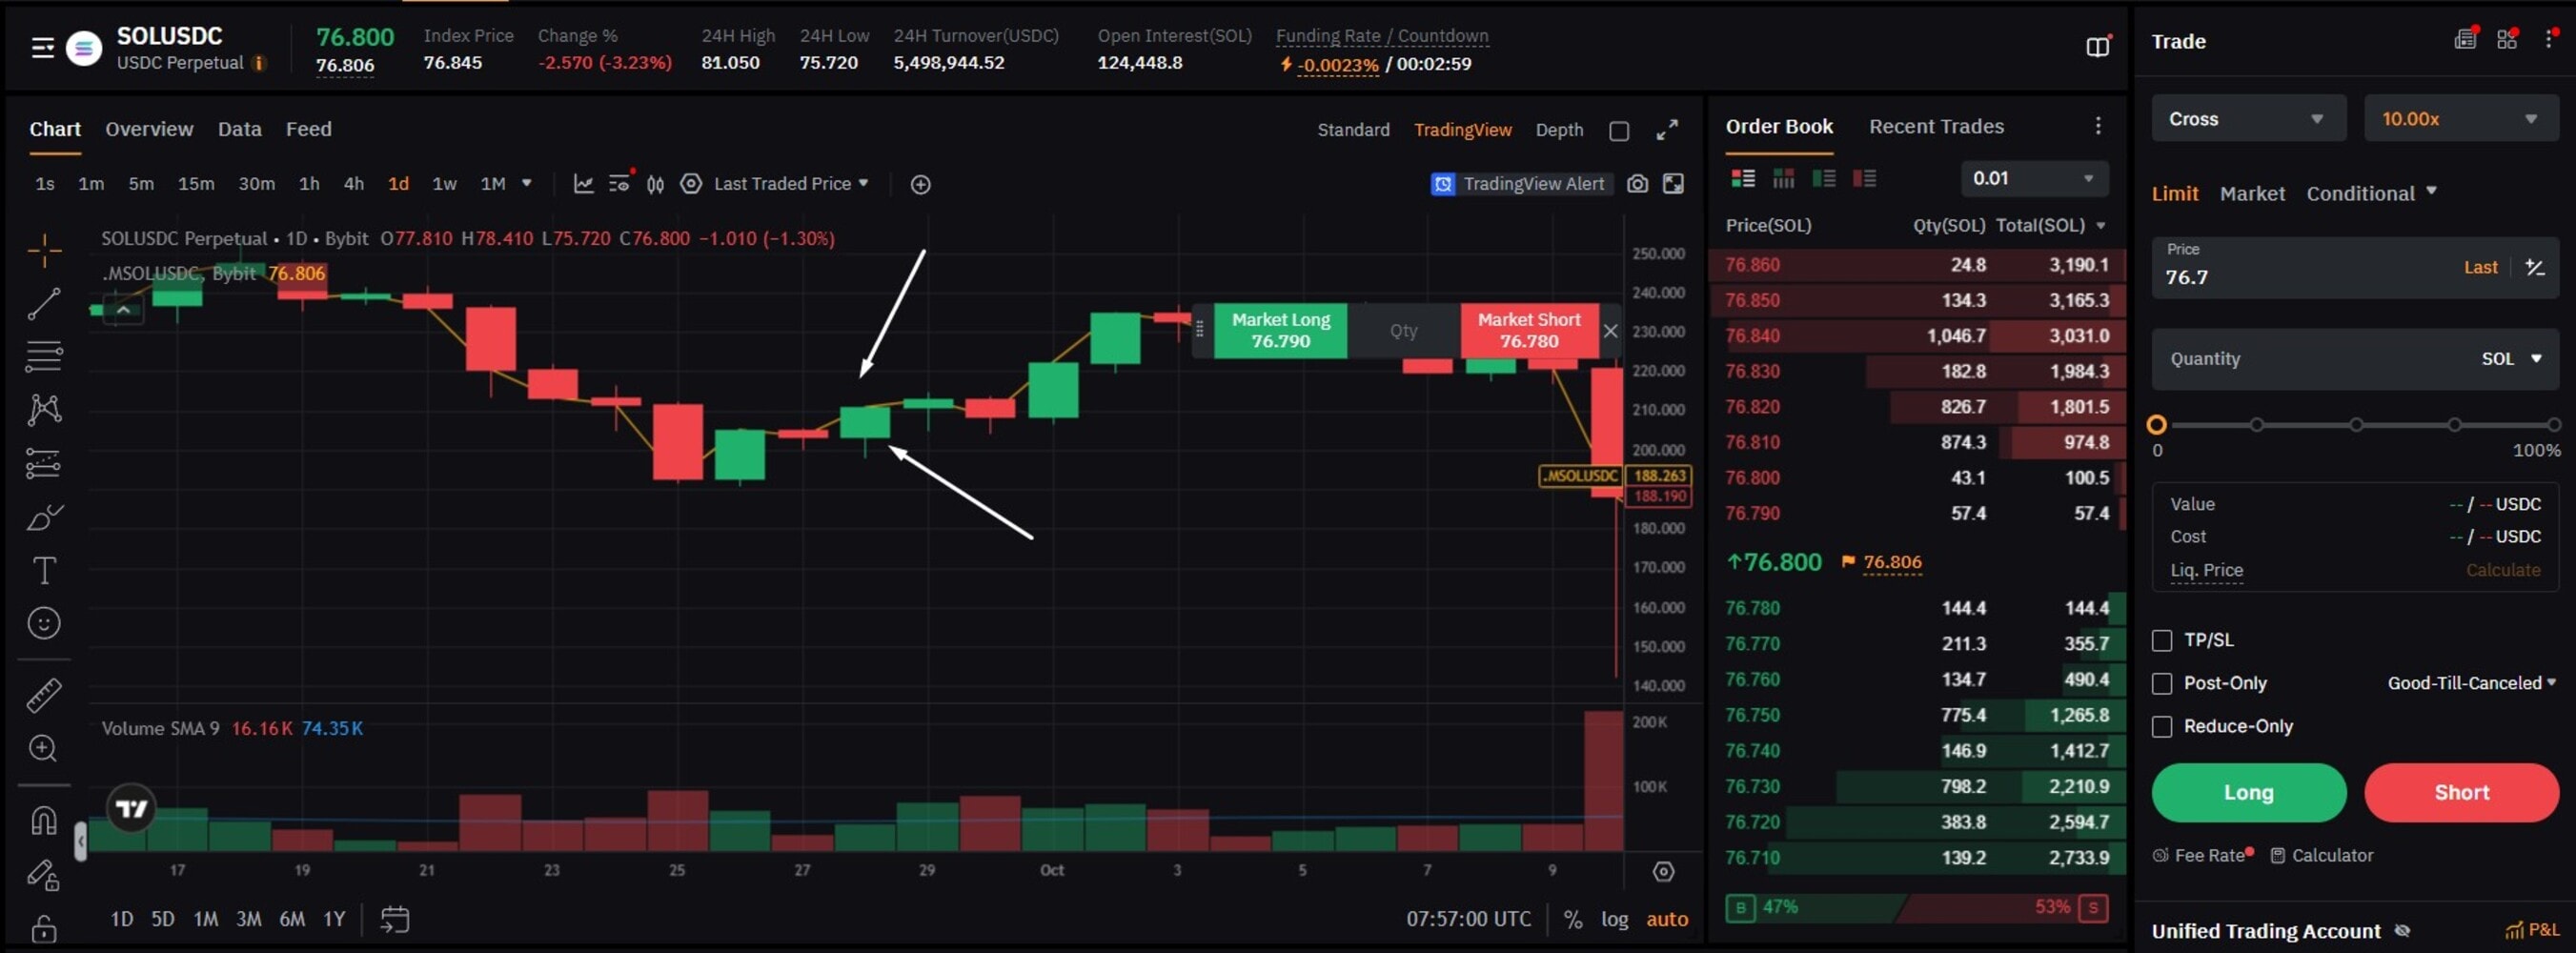
2. Bullish Engulfing Pattern
This pattern consists of two candles. The first candle is bearish, followed by a larger bullish (green) candle that fully covers it. This shows a shift in momentum from sellers to buyers. The pattern is stronger if it occurs at the end of a pullback within an uptrend. Volume confirmation increases the signal’s reliability, as higher trading volume suggests genuine buying interest rather than temporary price manipulation.
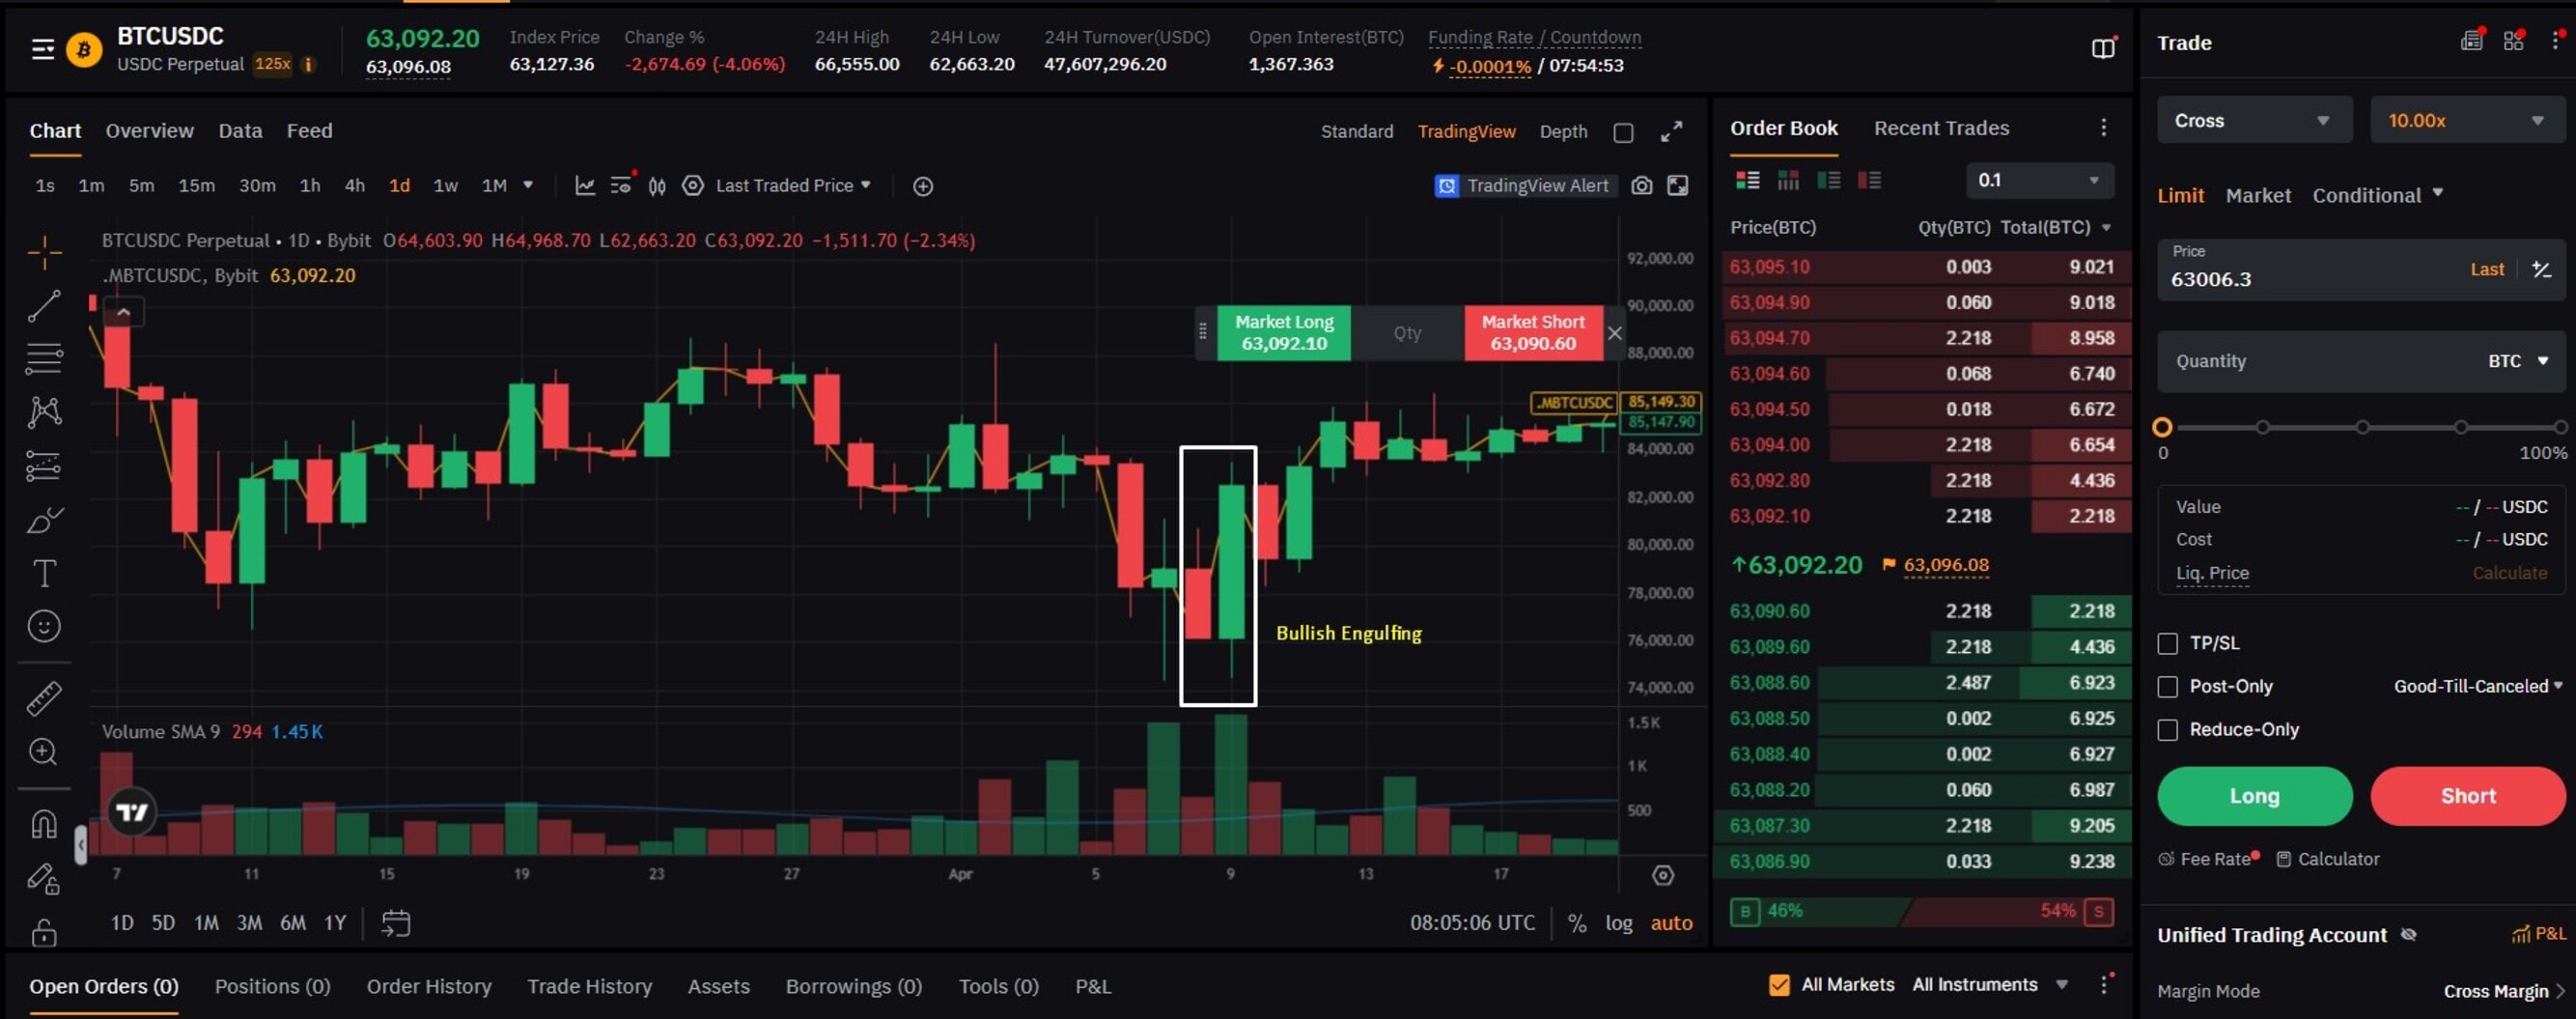
3. Morning Star
The morning star is a three-candle pattern signaling a potential reversal from a downtrend to an uptrend. It starts with a strong bearish candle, then a small candle with a small body that signals market indecision (can be either bullish or bearish), and ends with a strong bullish candle closing above the midpoint of the first candle.
This pattern reflects weakening selling pressure and growing buyer confidence. Traders often look for this pattern near support levels and combine it with trend analysis and volume to confirm the reversal.
4. Three White Soldiers
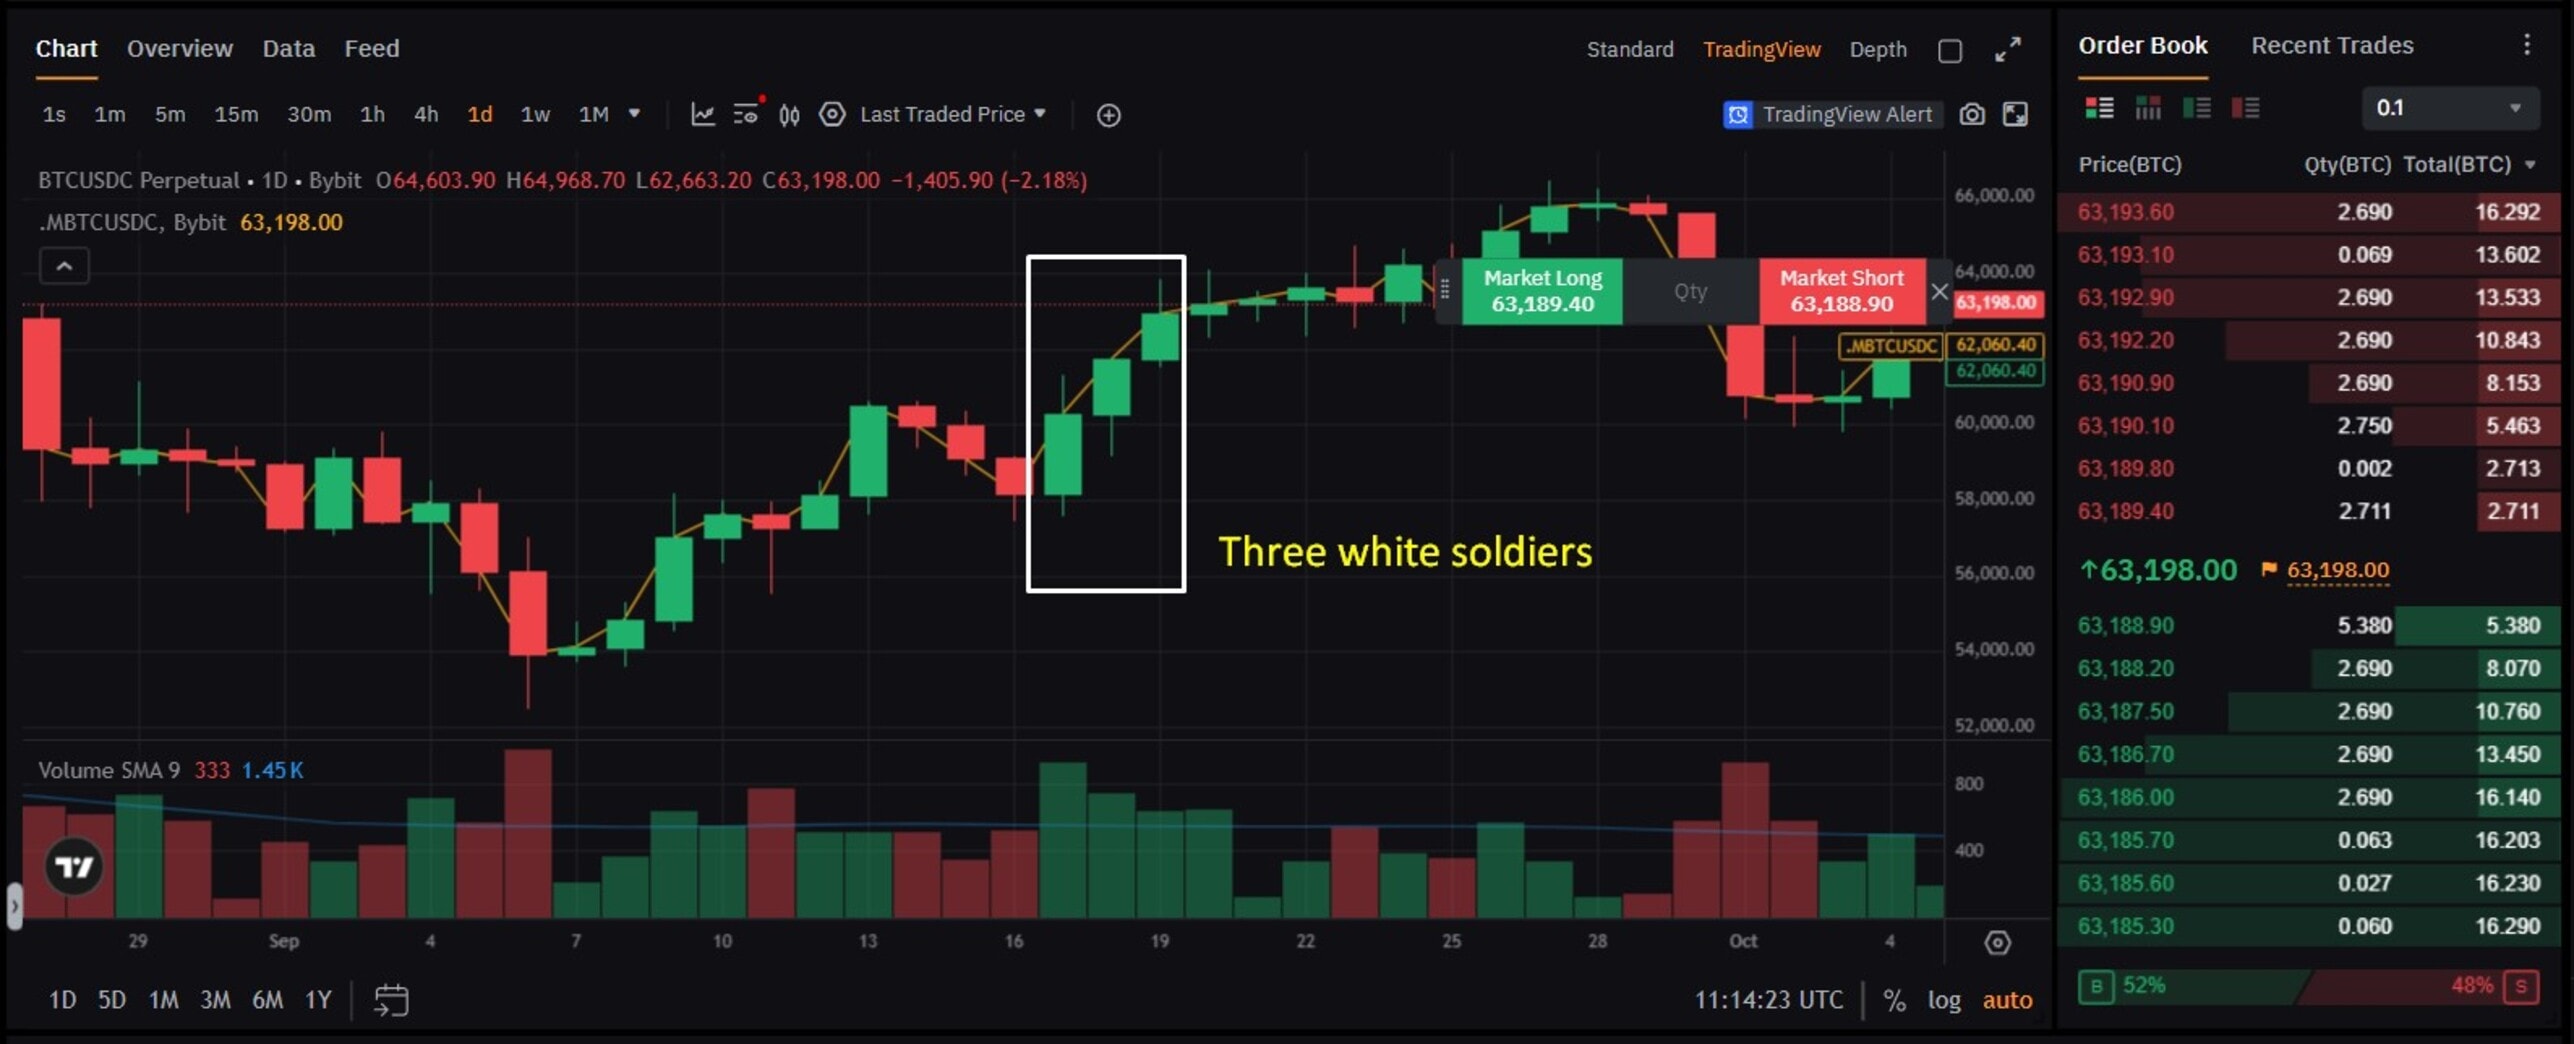
This is a bullish reversal pattern that appears after a bearish downtrend and signals strong buying momentum. This pattern is easy to spot as it is made up of three long bullish candles that all open close to the previous bullish candle’s body and maintain an uptrend to close higher than the last. This indicates sustained buyer pressure accompanied by strong bullish momentum.
Bearish Candlestick Patterns
1. Shooting Star
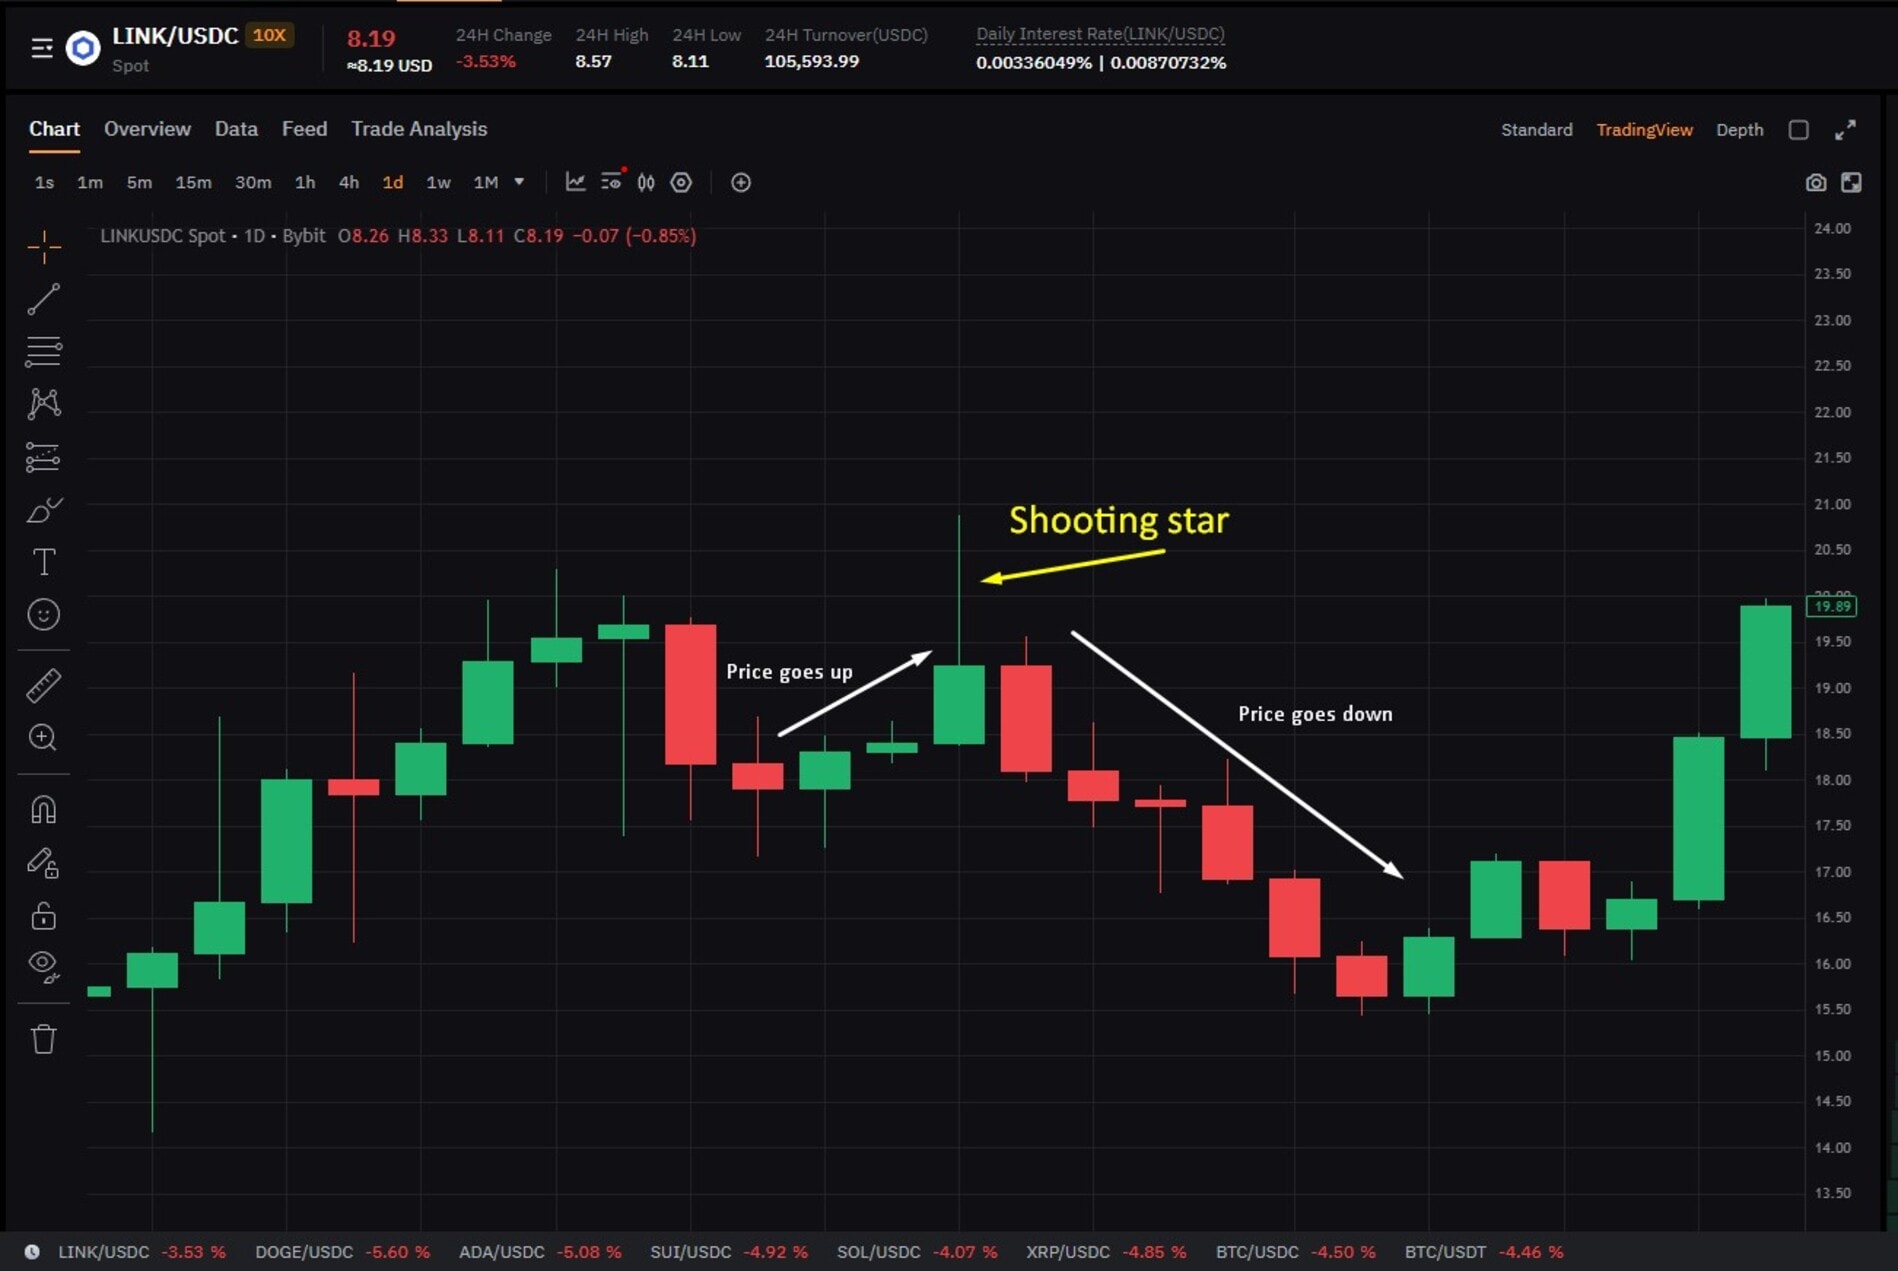
A shooting star has a small body near the bottom of the candle with a long upper shadow. This shows that buyers pushed the price higher during the session, but sellers regained control and closed the candle near the opening price. The long upper wick signals rejection of higher prices and potential bearish reversal. Traders often look for confirmation from the next candle before entering a short position.
2. Bearish Engulfing
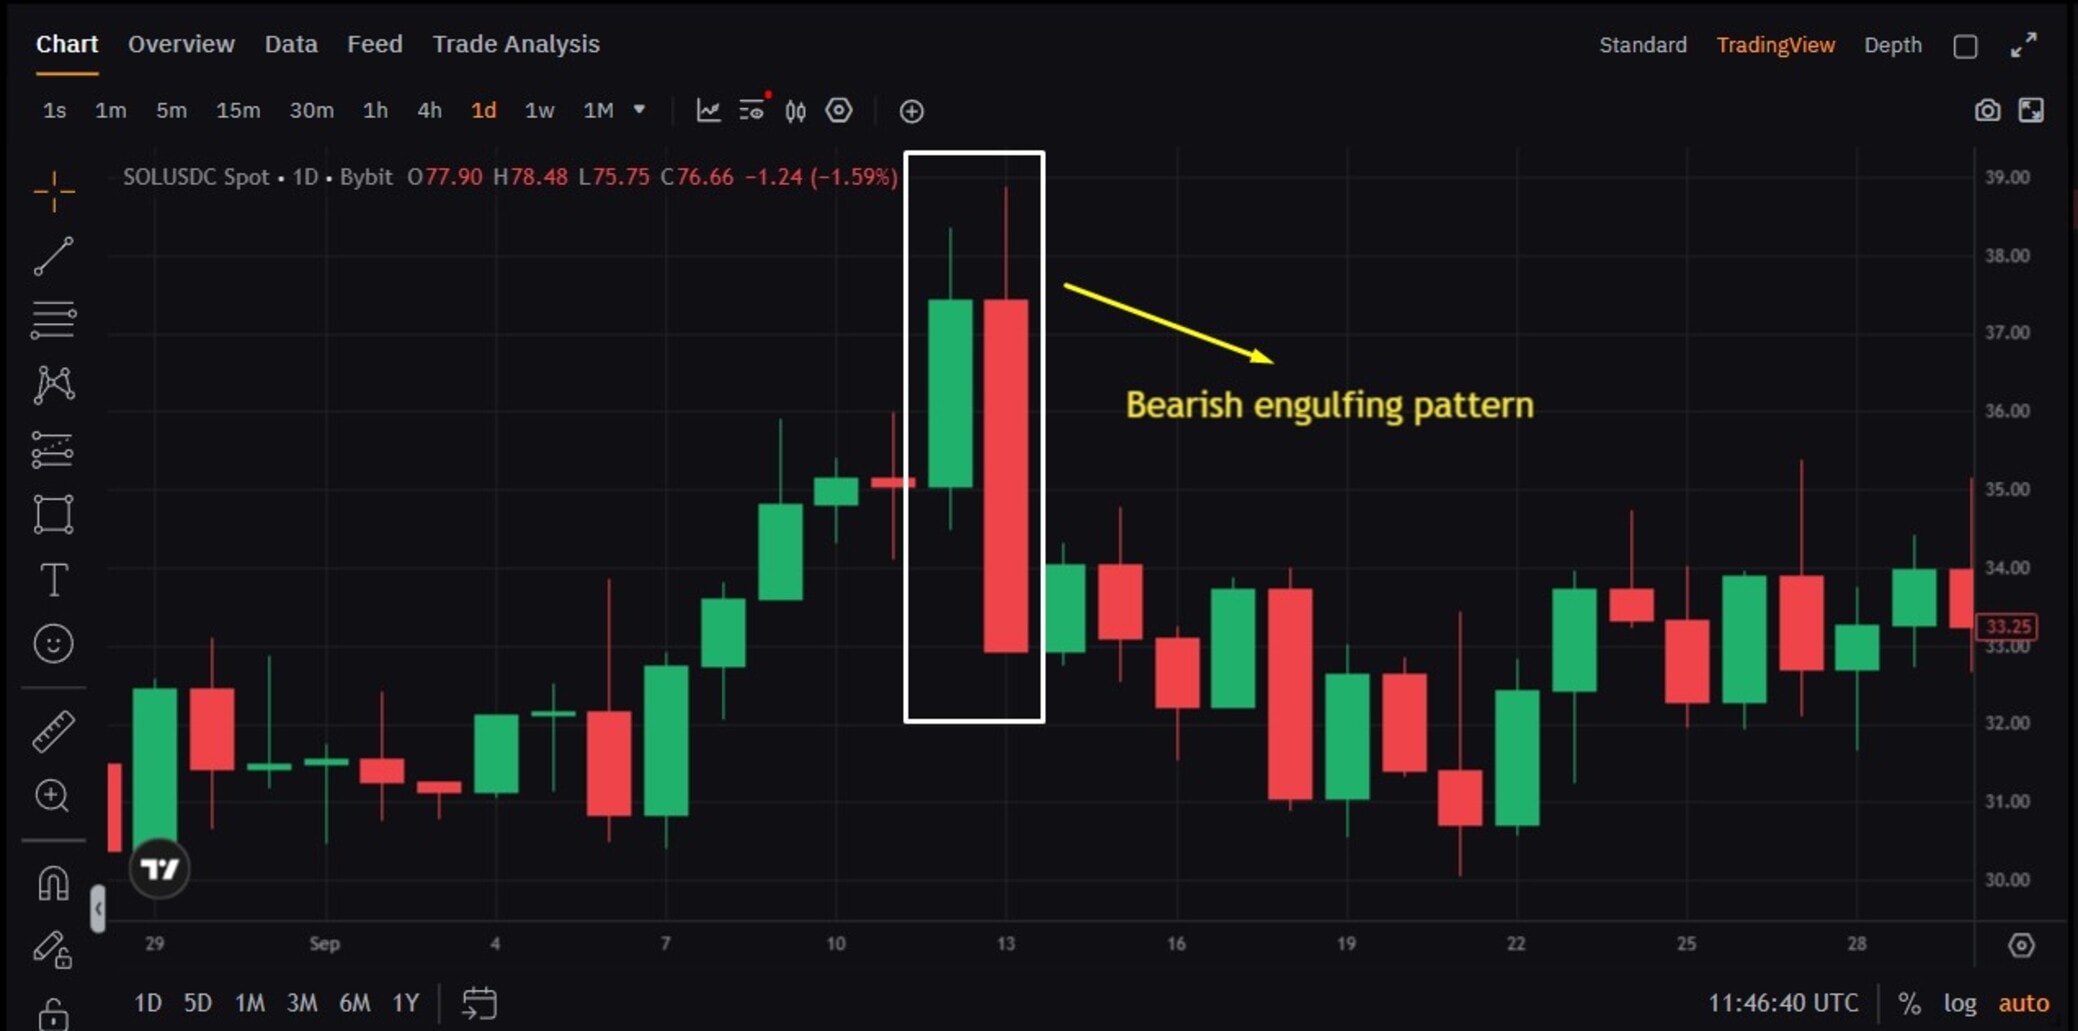
The bearish engulfing pattern occurs when a large red candle fully covers the previous green candle. This indicates a shift from buying pressure to selling pressure. The pattern is strongest when it forms after an uptrend or near a resistance level. Higher trading volume during the engulfing candle adds credibility to the pattern, showing that sellers are actively dominating the market.
3. Evening Star
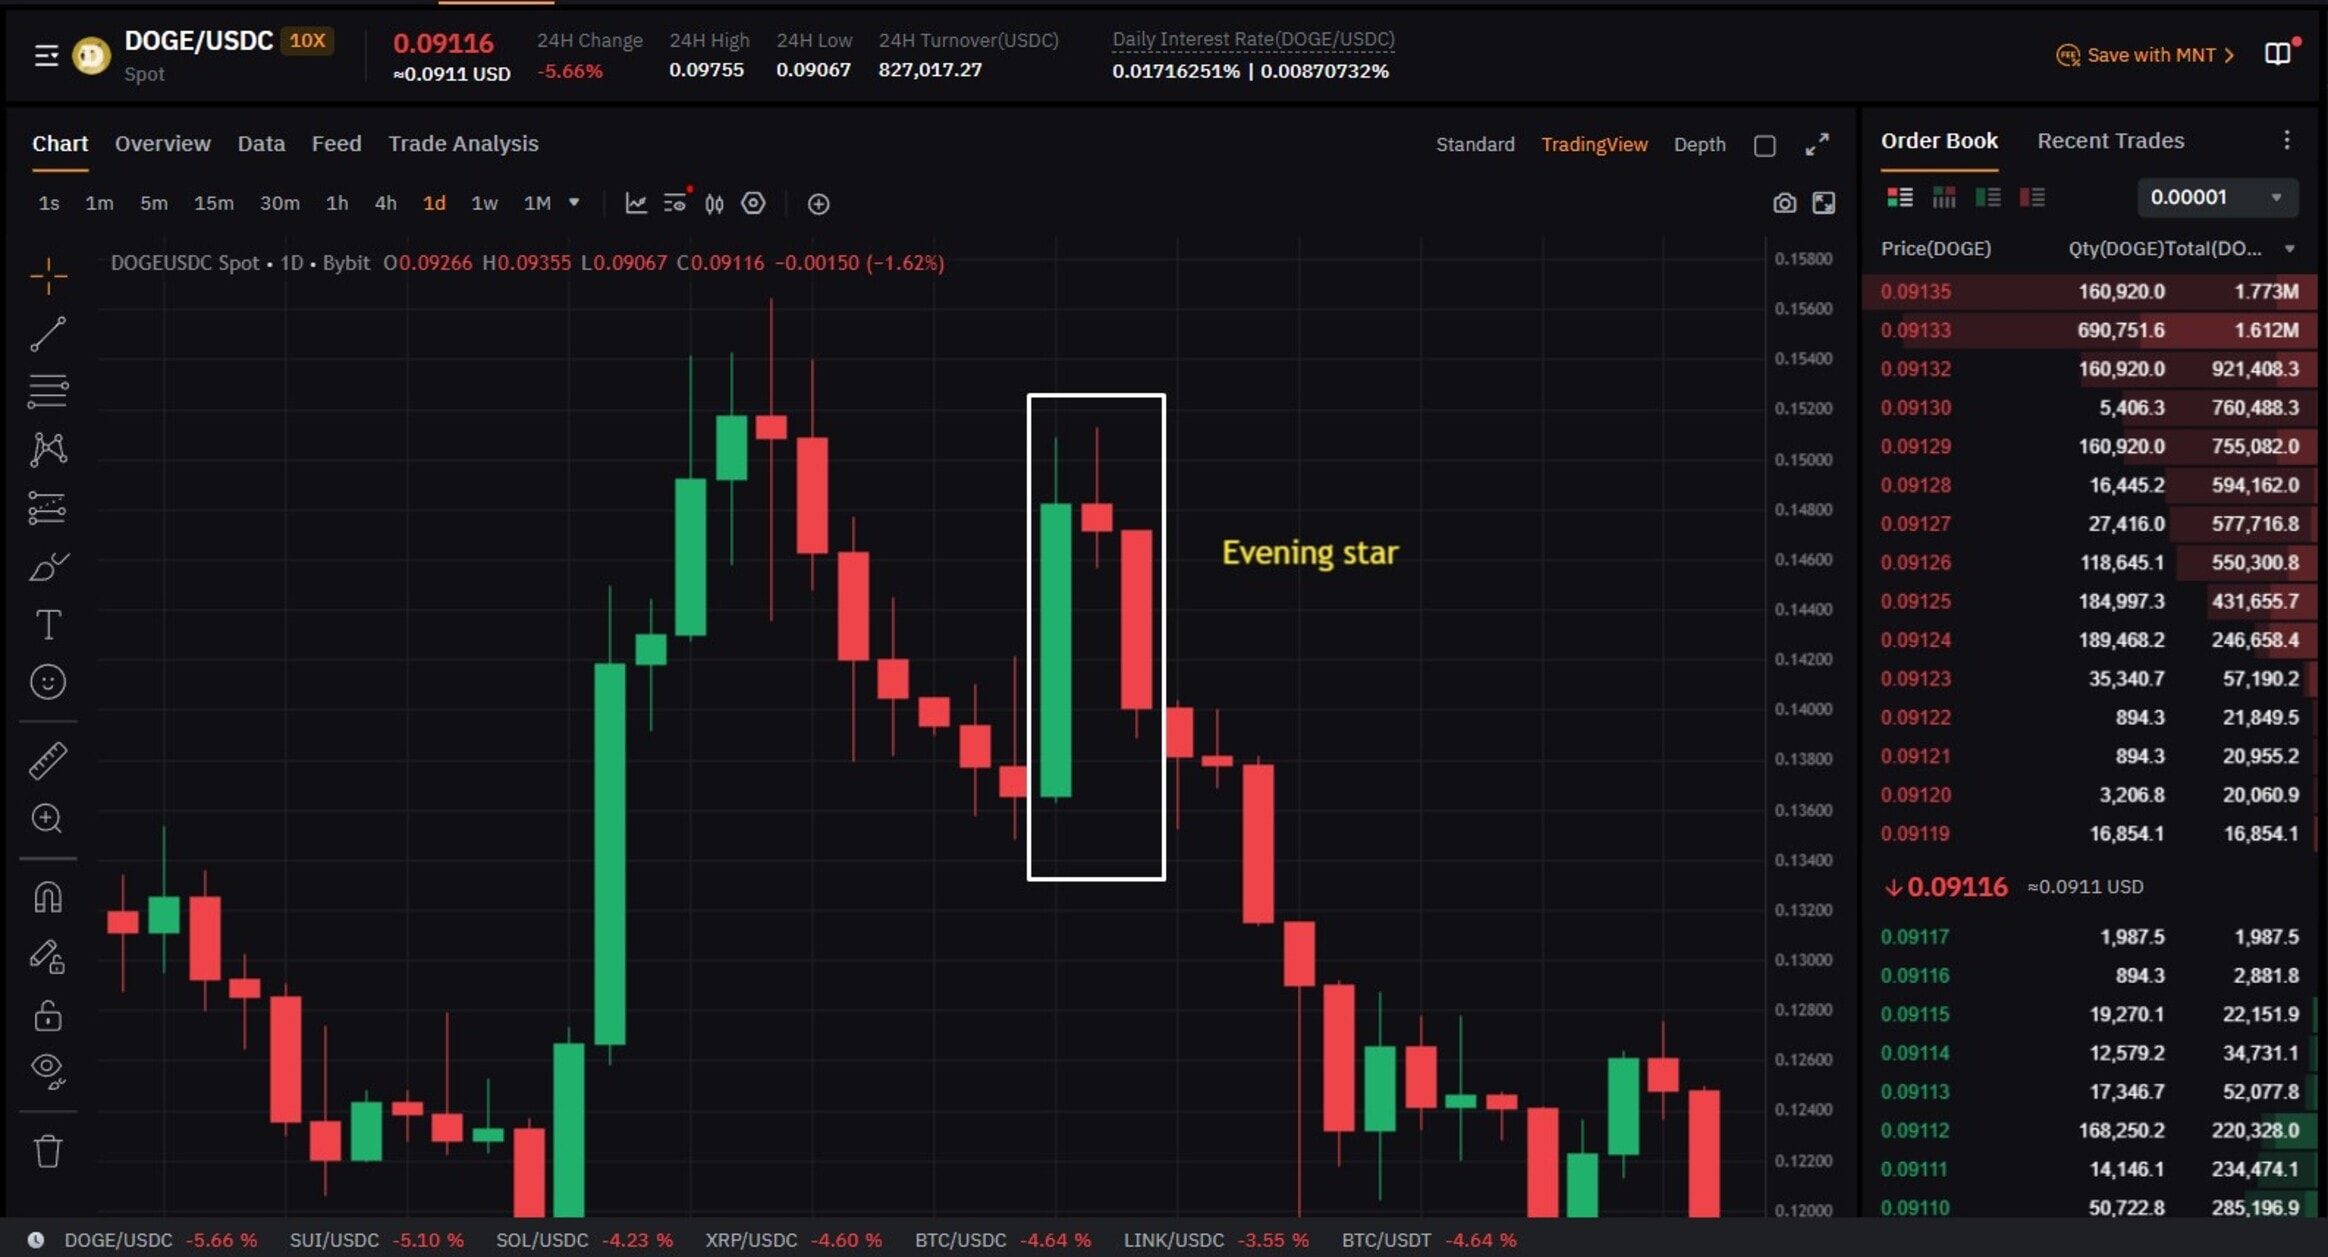
This is a bearish reversal pattern that appears after an uptrend and signals that buying momentum may be weakening. It begins with a strong bullish candle, followed by a small indecision candle with a small body, and ends with a strong bearish candle closing below the midpoint of the first candle.
4. Three Black Crows
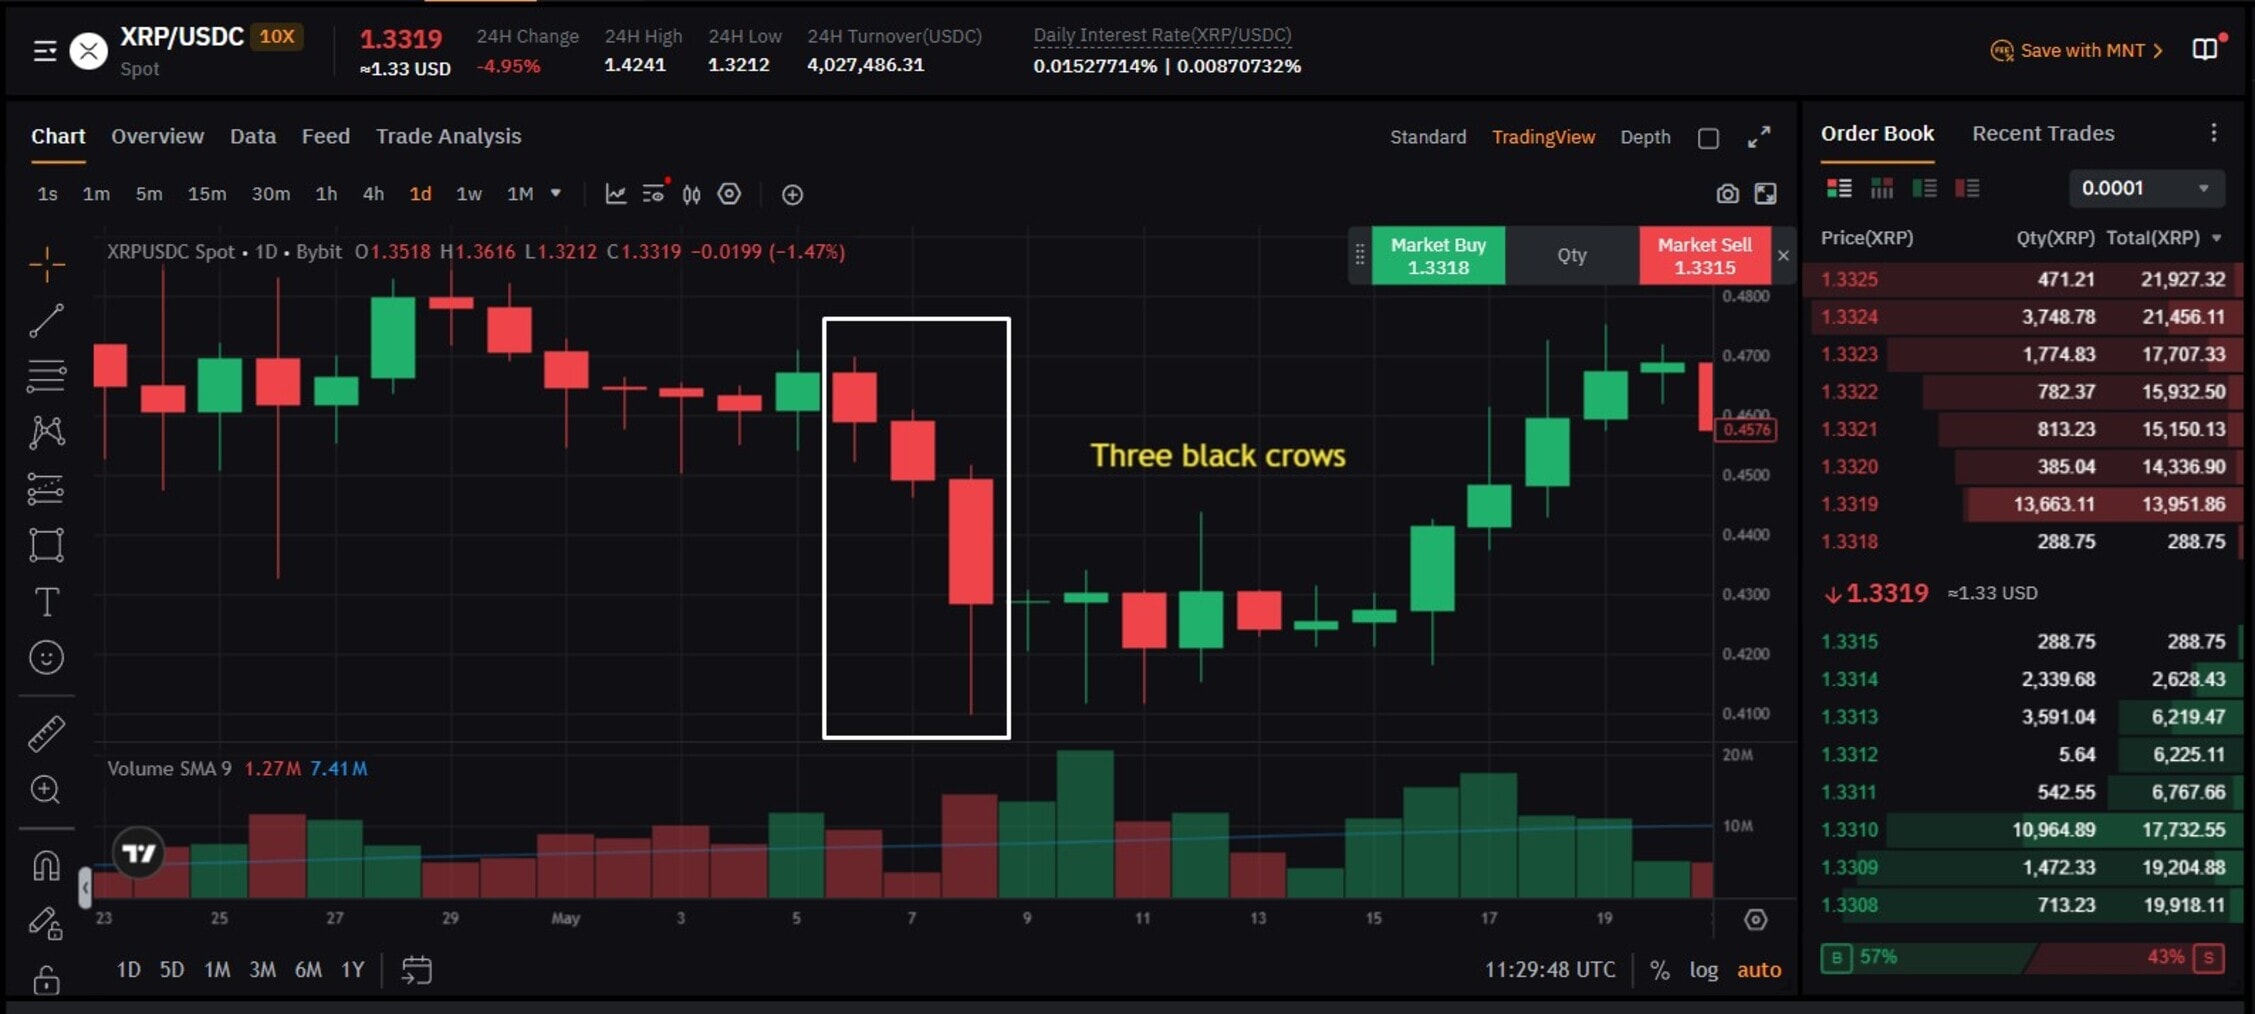
This pattern is similar to the Three White Soldiers, but for bearish trends. The Three Black Crows candlestick pattern is made up of three bearish candles, each with a lower close than the last one and a small or absent lower wick. This indicates strong and sustained selling pressure.
The pattern often appears after an uptrend or consolidation and signals that bears are taking control. Traders should monitor nearby support levels to manage risk, as a bounce can occur if the price becomes oversold.
Continuation Candlestick Patterns
Continuation patterns suggest that the current trend is likely to persist rather than reverse. They are especially useful for identifying pauses, minor retracements, or consolidations within an ongoing trend. Combining these patterns with trend context, support and resistance, and volume improves reliability. Here are the continuation candlestick patterns
1. Doji
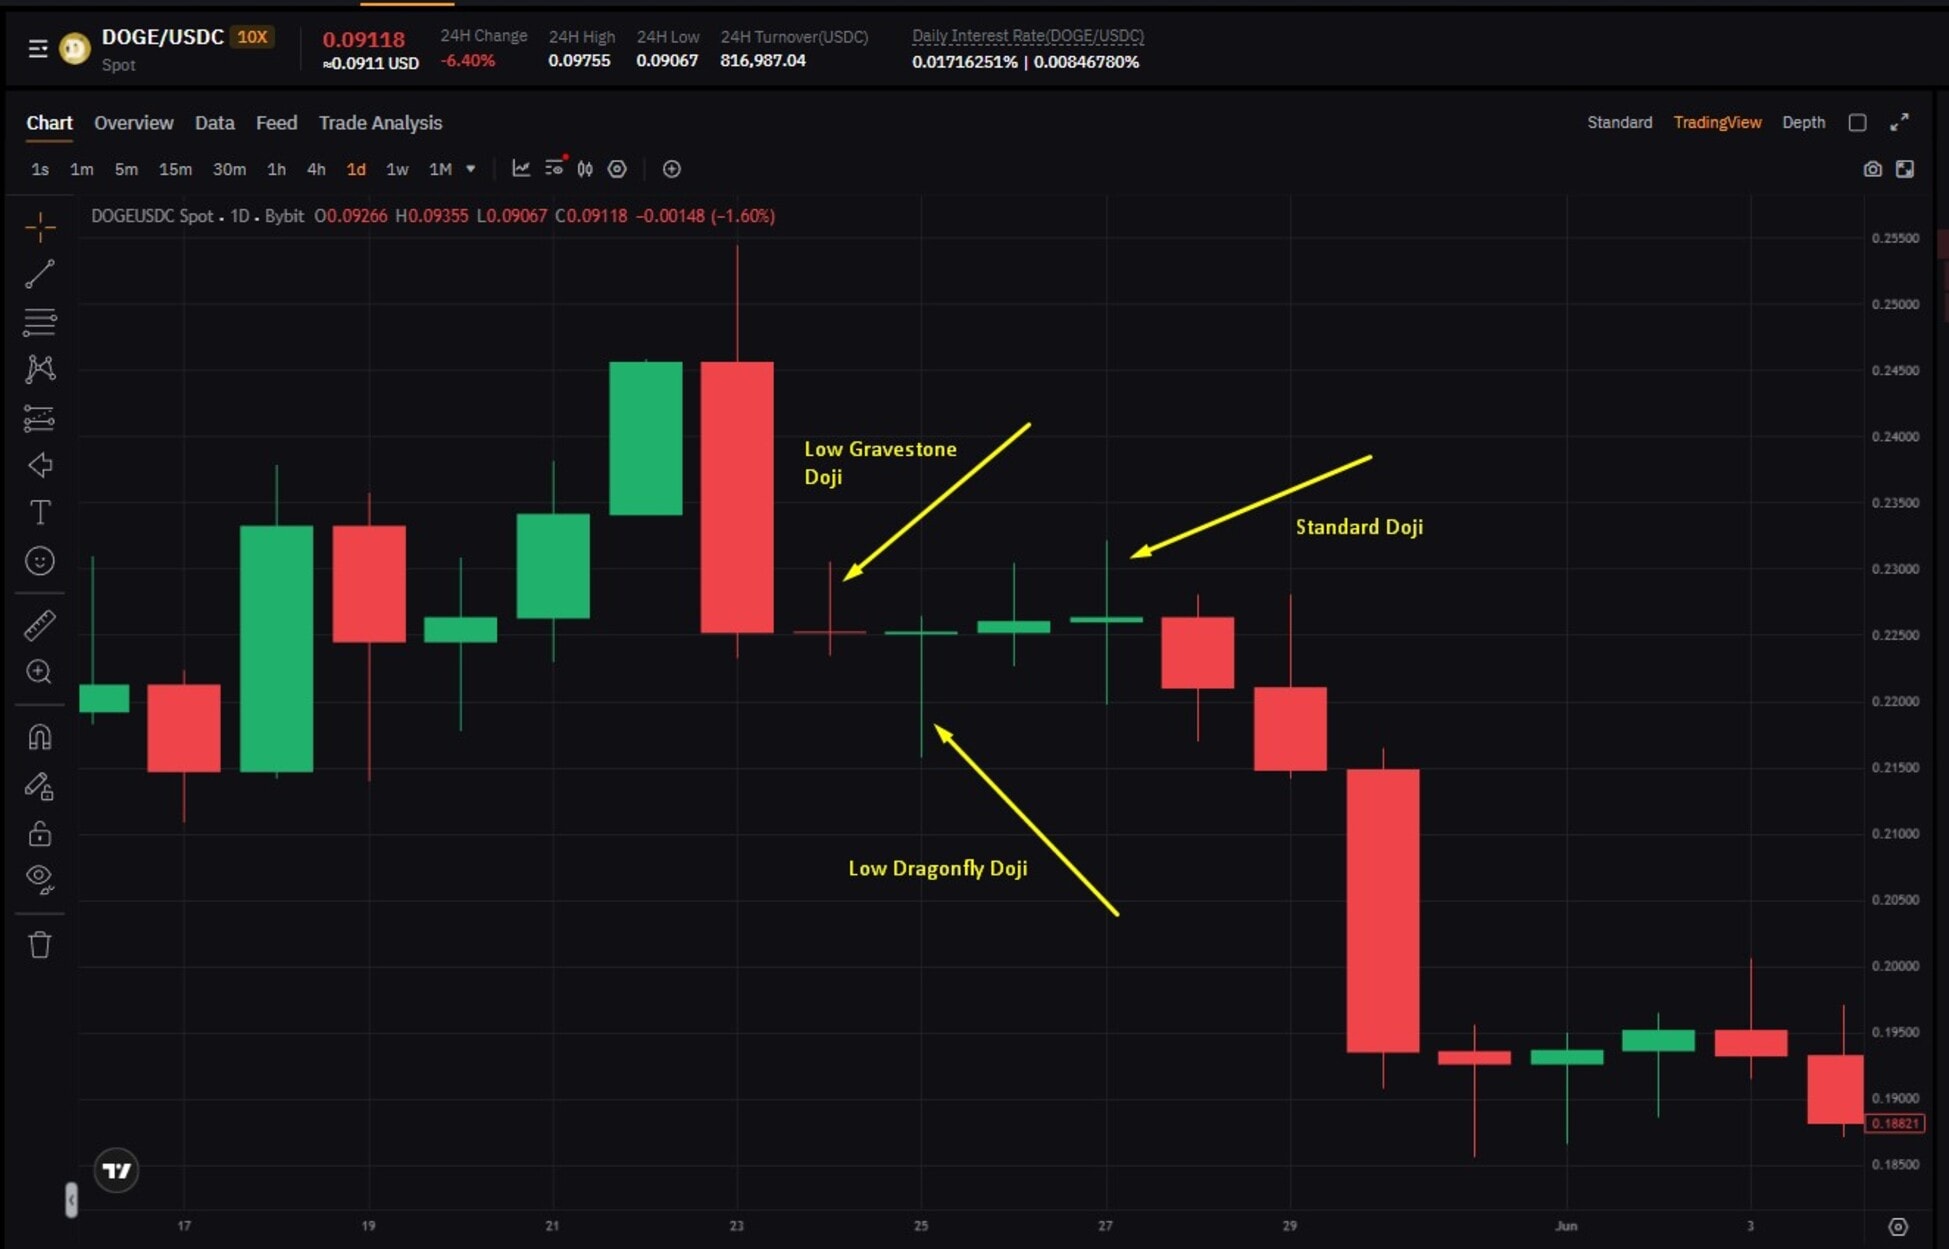
A Doji forms when the open and close prices are nearly equal, creating a very small or almost invisible body. This shows indecision in the market. Long upper wicks indicate that buyers tried to push the price higher but faced selling pressure. Long lower wicks indicate that sellers attempted to push the price down but were met with buying pressure.
In a bullish trend, a Doji can signal a temporary pause before the price resumes its upward trend. Meanwhile, a Doji in a bearish trend can signal a short-term consolidation before a further decline. Volume and context around support or resistance levels help determine whether the trend will continue.
2. Rising Three Methods

The rising three methods is a bullish continuation pattern composed of a strong bullish candle, followed by several small bearish or neutral candles contained within the range of the first candle, and finished with another strong bullish candle closing above the initial candle.
This shows that the market took a short pause, but buyers remain in control. Traders often interpret this pattern as a sign to hold or add to long positions because momentum is likely to continue upward.
3. Falling Three Methods
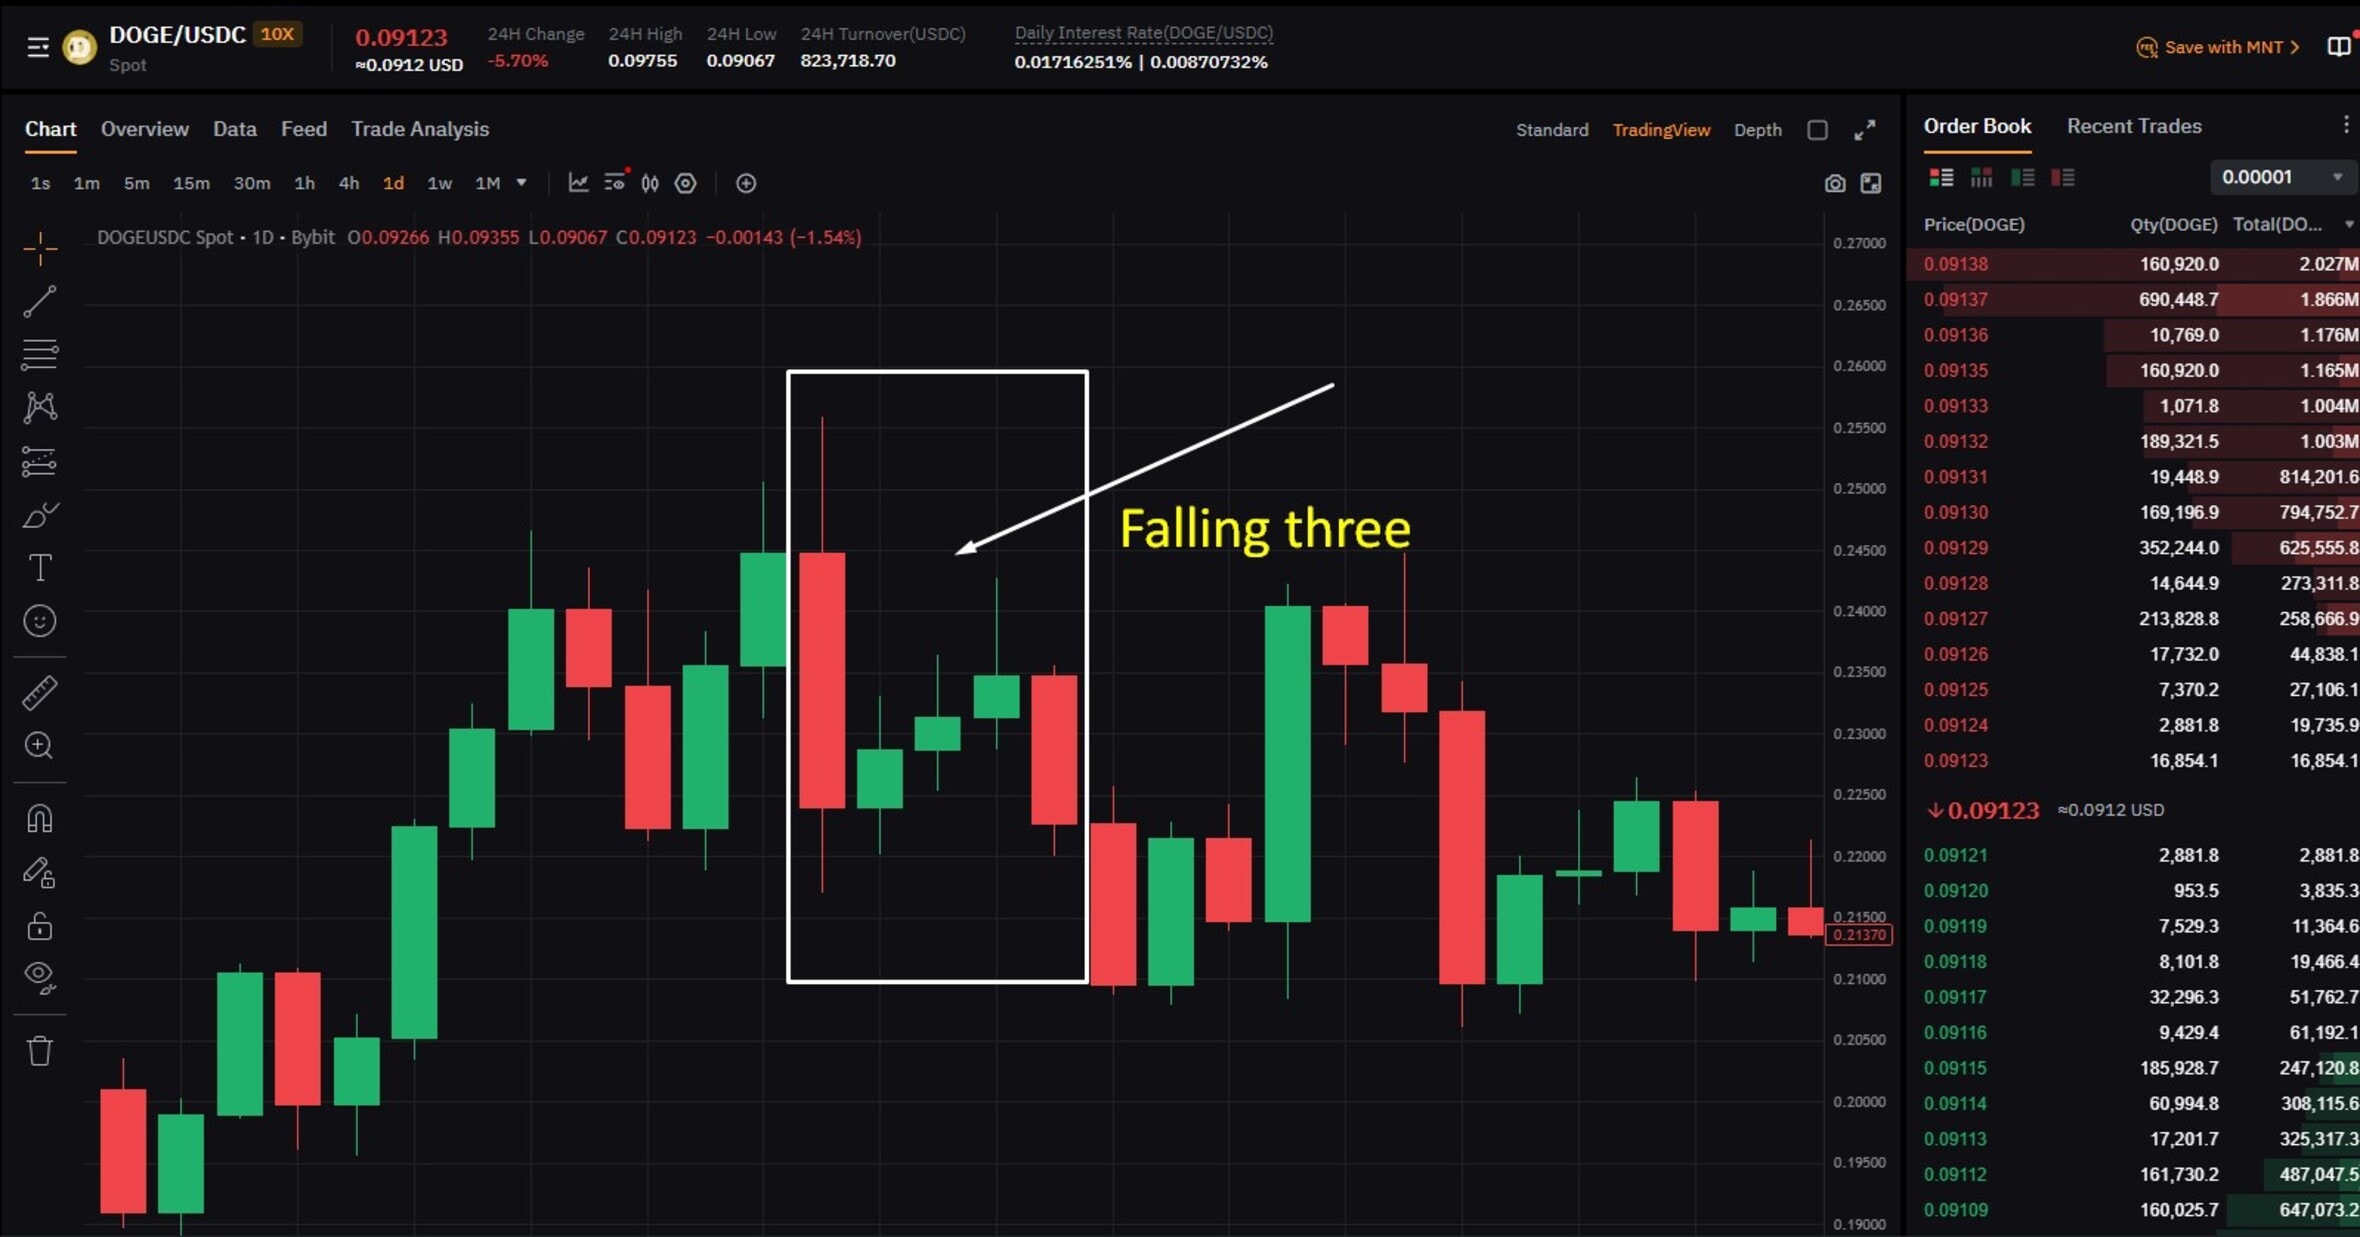
The falling three methods are the bearish counterpart to the rising three methods. It starts with a strong bearish candle, followed by several small bullish or neutral candles that stay within the range of the first candle, and ends with another strong bearish candle closing below the first. This pattern indicates a temporary pause in selling before the downtrend resumes. Traders use this to anticipate further downward movement and plan entries or manage risk in short positions.
4. Spinning Top
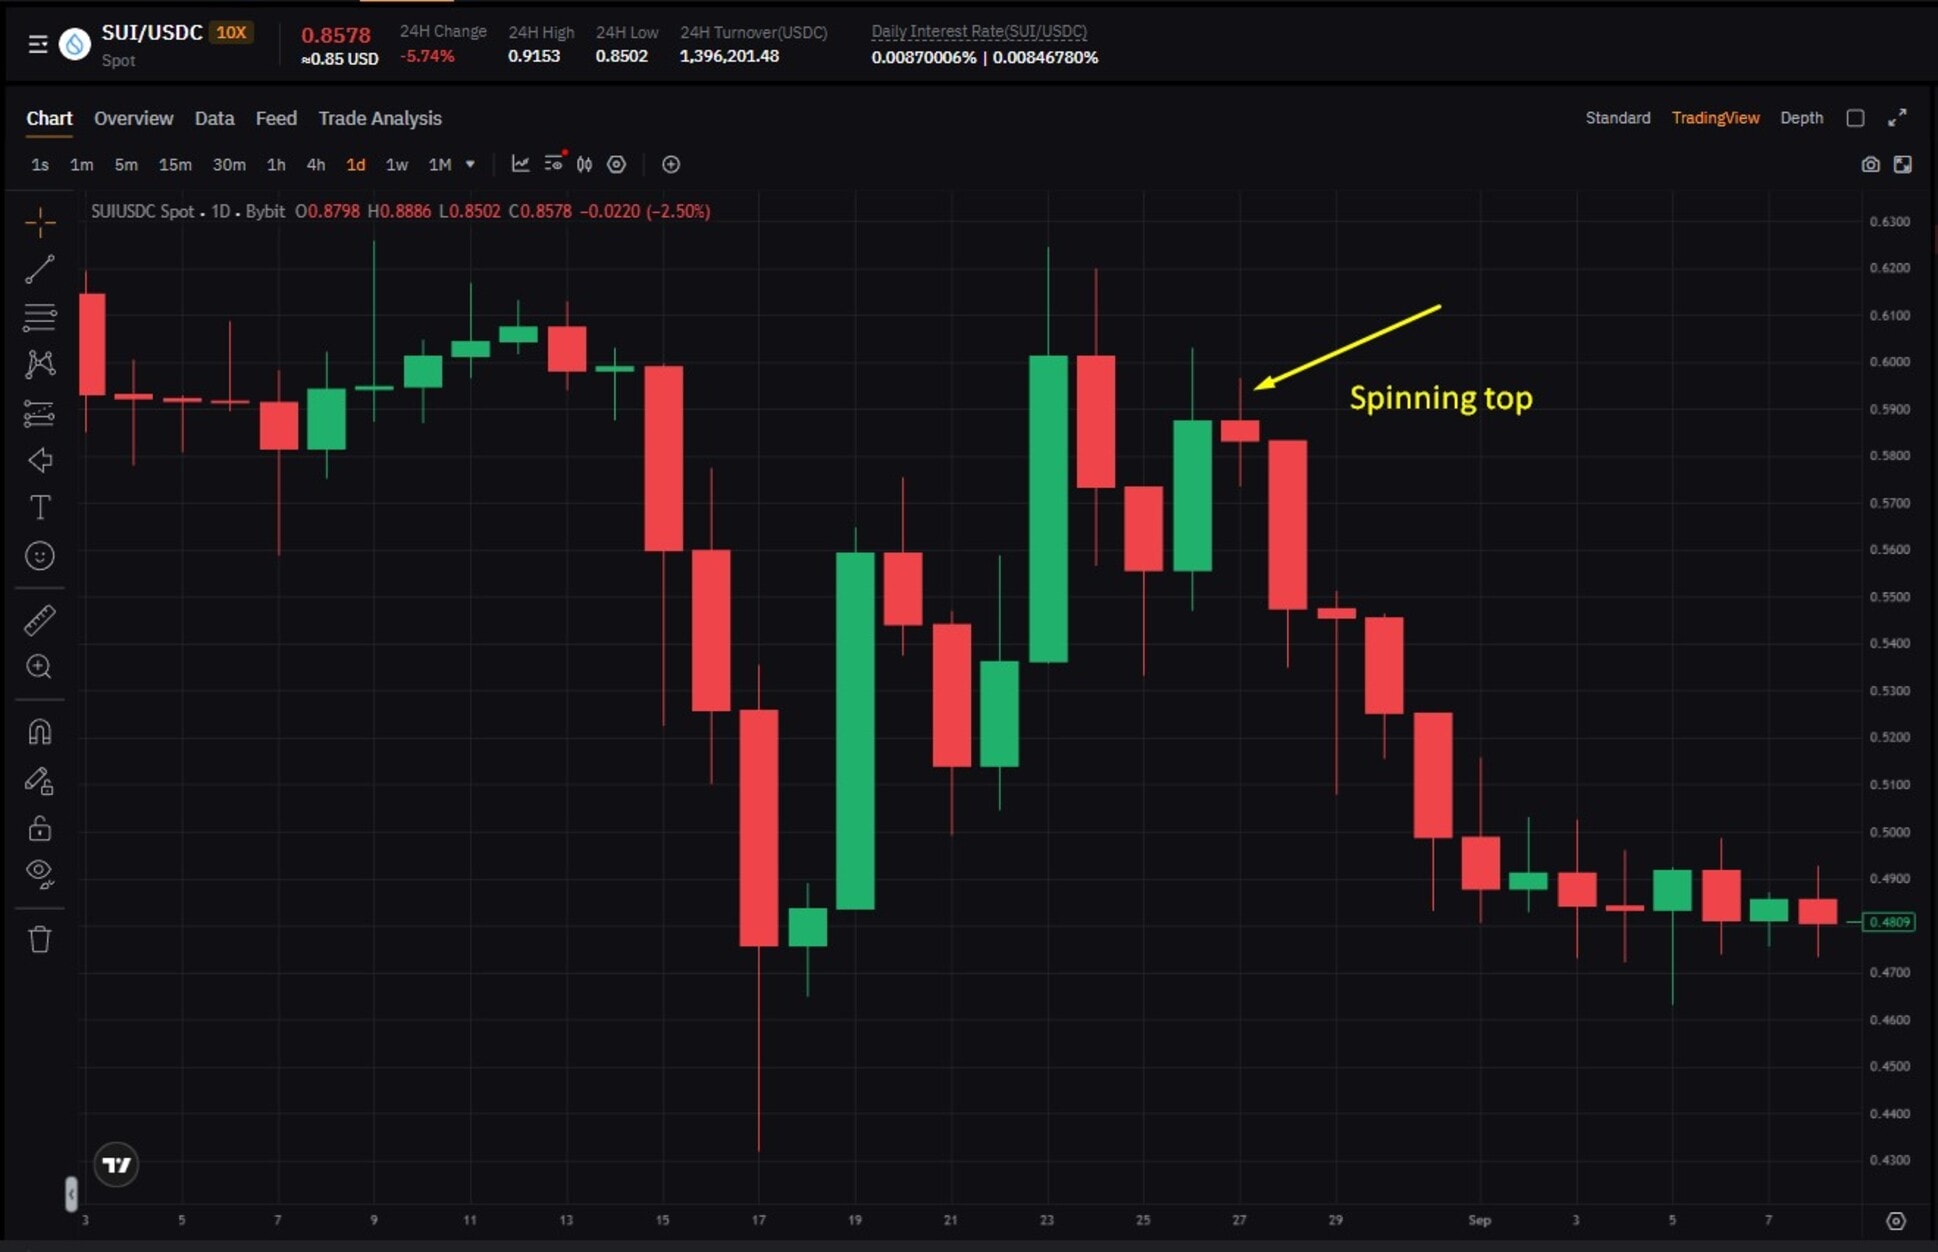
A spinning top has a small body with wicks extending above and below. This pattern shows that both buyers and sellers were active, but neither gained control. In an uptrend, a spinning top often signals a brief consolidation before the bullish trend continues.
In a downtrend, it indicates hesitation before the bearish trend resumes. Spinning tops are more useful when combined with trend direction, volume, and nearby support or resistance levels to confirm whether the market is likely to continue the current move.
How to Read Multiple Candlesticks Together
Single candlesticks provide snapshots, but analyzing multiple candles together reveals stronger insights about trends, reversals, and market pauses. Below are the ways to read multiple candlesticks together.
Identifying Trends
When multiple bullish candles form higher highs and higher closes, it signals an uptrend. Conversely, multiple bearish candles forming lower lows and lower closes indicate a downtrend. Traders can use these sequences to confirm market direction before entering positions. Watching the size of the bodies and the length of wicks over several candles helps assess the strength of the trend.
Spotting Reversals
Reversals are more reliable when multiple candles show a shift in control between buyers and sellers. Patterns such as morning star, evening star, or bullish and bearish engulfing sequences over a few candles suggest that momentum may be changing. Reversal signals are strongest near support or resistance levels and are even stronger when combined with volume confirmation.
Reading Consolidation
Consolidation occurs when multiple small-bodied candles form within a narrow range, often with wicks on both ends. This signals market indecision or a temporary pause. Traders can use consolidation to anticipate breakouts or breakdowns, especially when combined with nearby trendlines or horizontal support and resistance.
Reading multiple candlesticks together gives a more complete picture than analyzing single candles. It allows traders to interpret momentum, pressure points, and potential turning points with higher confidence.
How to Use Candlestick Charts in Crypto Trading
Traders can use candlestick charts in several ways:
Spotting Trends: Consecutive bullish candles indicate buyers are in control, signaling an uptrend. Consecutive bearish candles show sellers dominating the market, signaling a downtrend. Observing body size and wick length helps assess the strength of the trend.Identifying Reversals: Patterns such as hammer, shooting star, morning star, and evening star help anticipate potential market reversals. A hammer near support can indicate that selling pressure is ending, while a shooting star near resistance may signal that buying pressure is weakening.Timing Entries and Exits: Candlestick patterns help determine potential entry and exit points. For example, a bullish engulfing pattern after a pullback can suggest a favorable entry point, while a bearish engulfing near a price peak may indicate a good time to take profits or close a position.Managing Risk: Long wicks show areas of price rejection, which can serve as reference points for setting stop-loss levels. This helps limit potential losses in volatile markets.Integrating with Advanced Strategies: Candlestick charts can be used alongside other tools, such as moving averages, trendlines, and leverage strategies. For traders interested in understanding leverage trading in crypto, this guide on what leverage trading in crypto is provides helpful background on how leverage works and the risks involved.
Common Mistakes When Reading Candlestick Charts
Many traders make avoidable mistakes that reduce the reliability of signals. These are some mistakes to be aware of if you want to improve your trading decisions.
Ignoring trend context: Interpreting a single candlestick without considering the overall trend can be misleading. For example, a bullish pattern in a strong downtrend may fail to produce a reversal. Always evaluate candlesticks within the context of the trend and nearby support or resistance levels.Overlooking volume: Candlestick patterns carry more weight when combined with trading volume. A reversal or continuation pattern with low volume may not be reliable. Volume confirms whether buyers or sellers are genuinely driving price action.Relying on a single candle: Single candles provide limited information. Patterns formed over multiple candles, such as morning star, three white soldiers, or three black crows, are often more reliable. Avoid making decisions based solely on one candle.Ignoring market volatility: Crypto markets are highly volatile. Patterns that work in stocks or forex may behave differently in crypto. Recognizing the impact of rapid price swings prevents misreading patterns and reduces risk.Misinterpreting Wicks: Long wicks are not always reversal signals. Upper wicks show where buyers faced resistance, and lower wicks show where sellers faced support. Consider the trend, candle position, and nearby levels before interpreting wicks.Overcomplicating patterns: Adding too many indicators or expecting patterns to predict exact price targets can be counterproductive. Candlestick charts are tools for interpreting sentiment and potential price movements, not guarantees of price direction.
Candlestick Charts vs Other Chart Types
Features Candlestick ChartLine ChartBar Chart Primary UseAnalyzing short-term and mid-term price actionIdentifying overall trendsDetailed price trackingData ShownOpen, high, low, closeClosing prices onlyOpen, high, low, closePattern RecognitionExcellent for spotting reversals, continuation, and momentumPoor; no insight into intraday price movementModerate; less intuitive than candlesticksBest ForDay trading, swing trading, spotting reversals, and trend analysisLong-term analysis, trend directionTraders who prefer raw price data without focusing on visual patternsVisual ClarityHigh color-coded for easy interpretationWeak; cannot capture intraday price actionModerate, detailed, but can appear noisyWeaknessCan feel cluttered with too much dataLacks volatility information, cannot show intraday momentumHarder to read quickly, less visually intuitive
Conclusion
Candlestick charts are a powerful tool for crypto traders, providing insights into market sentiment, momentum, and potential reversals. Using single candles, multi-candle patterns, and continuation formations in context with trends, support and resistance levels, and volume can improve your crypto trading decisions. Although no pattern guarantees price movement, mastering candlestick analysis helps anticipate market behavior, manage risk, and make more informed entries and exits.
FAQs
What is the most reliable candlestick pattern?
There is no single candlestick pattern that guarantees success, but some patterns have historically shown high reliability. Patterns like the hammer, bullish and bearish engulfing, morning star, and evening star are commonly used to spot potential reversals. Reliability increases when these patterns appear at key support or resistance levels and are confirmed with volume or trend indicators.
How accurate are candlestick patterns?
Candlestick patterns provide insight into market sentiment rather than precise predictions. Accuracy depends on context, including trend direction, volume, and the presence of other technical indicators. Using candlestick analysis alongside support and resistance levels, trendlines, and trading volume improves reliability and reduces false signals.
Can beginners use candlestick charts effectively?
Yes, beginners can start by focusing on basic patterns, such as the hammer, shooting star, and engulfing candlestick patterns. Understanding what each candle represents, including open, high, low, and close, helps beginners interpret market sentiment. Practicing with historical charts and combining candlestick observation with trendlines and support and resistance levels accelerates learning.
What timeframe is best for candlestick trading?
The best timeframe depends on trading style. Day traders often use 1-minute to 1-hour charts to catch short-term movements. Swing traders might prefer 4-hour or daily charts to capture broader trends. Long-term investors can monitor daily or weekly charts to identify significant market moves. Always align the timeframe with strategy and risk tolerance.
Which chart is best for day trading?
Candlestick charts are the most popular choice for crypto day trading strategies. They provide detailed information about price action, highlight patterns, and make it easier to spot reversals and momentum shifts. Line charts lack intraday detail, and bar charts can be harder to interpret quickly, making candlestick charts ideal for active trading.
What does a Doji candle indicate?
A Doji forms when the open and close prices are nearly equal, producing a very small body. It signals indecision in the market, showing that buyers and sellers are balanced. A Doji at a support or resistance level can indicate a potential reversal, but confirmation from the following candles or additional indicators is important before acting.
