

Hedera’s HBAR is outperforming the broader crypto market. While Bitcoin and Ethereum are up around 2% over the past day, HBAR price today has gained nearly 10% over the past week and about 8% in the last 24 hours, trading near $0.096 at press time.
The rally has raised expectations of a breakout. But momentum, volume, and derivatives data suggest risk is rising faster than conviction.
Sponsored
Sponsored
Falling Wedge Breakout Hopes Build, But With A Risk
HBAR has been trading inside a falling wedge pattern since late 2025.
Since early February, HBAR has rebounded from close to the lower boundary of this structure and climbed toward the upper trendline near $0.098. This level has capped the price multiple times and now acts as key resistance.
If HBAR breaks and holds above this zone, the wedge’s measured move points toward an upside of over 50% from current levels. However, momentum is starting to weaken. The Relative Strength Index, or RSI, measures buying and selling strength. When RSI rises, momentum improves. When it weakens, momentum fades.
Between February 6 and February 12, HBAR struggled to move decisively above $0.098 and began forming a potential lower high. At the same time, RSI continued making higher highs.
Want more token insights like this? Sign up for Editor Harsh Notariya’s Daily Crypto Newsletter here.
This creates a hidden bearish divergence. It happens when the price fails to confirm improving momentum. It often signals that buyers are becoming stretched near resistance.
Sponsored
Sponsored
This does not indicate a trend reversal. But it shows that upside efficiency is declining as the price approaches a critical level. The divergence threat passes if the current HBAR price candle touches $0.098, invalidating the lower-high theory.
Money Flow and Derivatives Data Show Rising Risks
Money and leverage indicators reinforce this warning. One key metric is Chaikin Money Flow, or CMF. CMF tracks whether large capital is flowing into or out of an asset by combining price and volume. When CMF stays above zero, strong institutional buying is present. When it remains below zero, major inflows are missing.
Between December 31 and February 11, HBAR’s CMF has trended higher while the price trended lower. This divergence supported the recent rebound. CMF has also broken above its descending trendline. But CMF remains below the zero line.
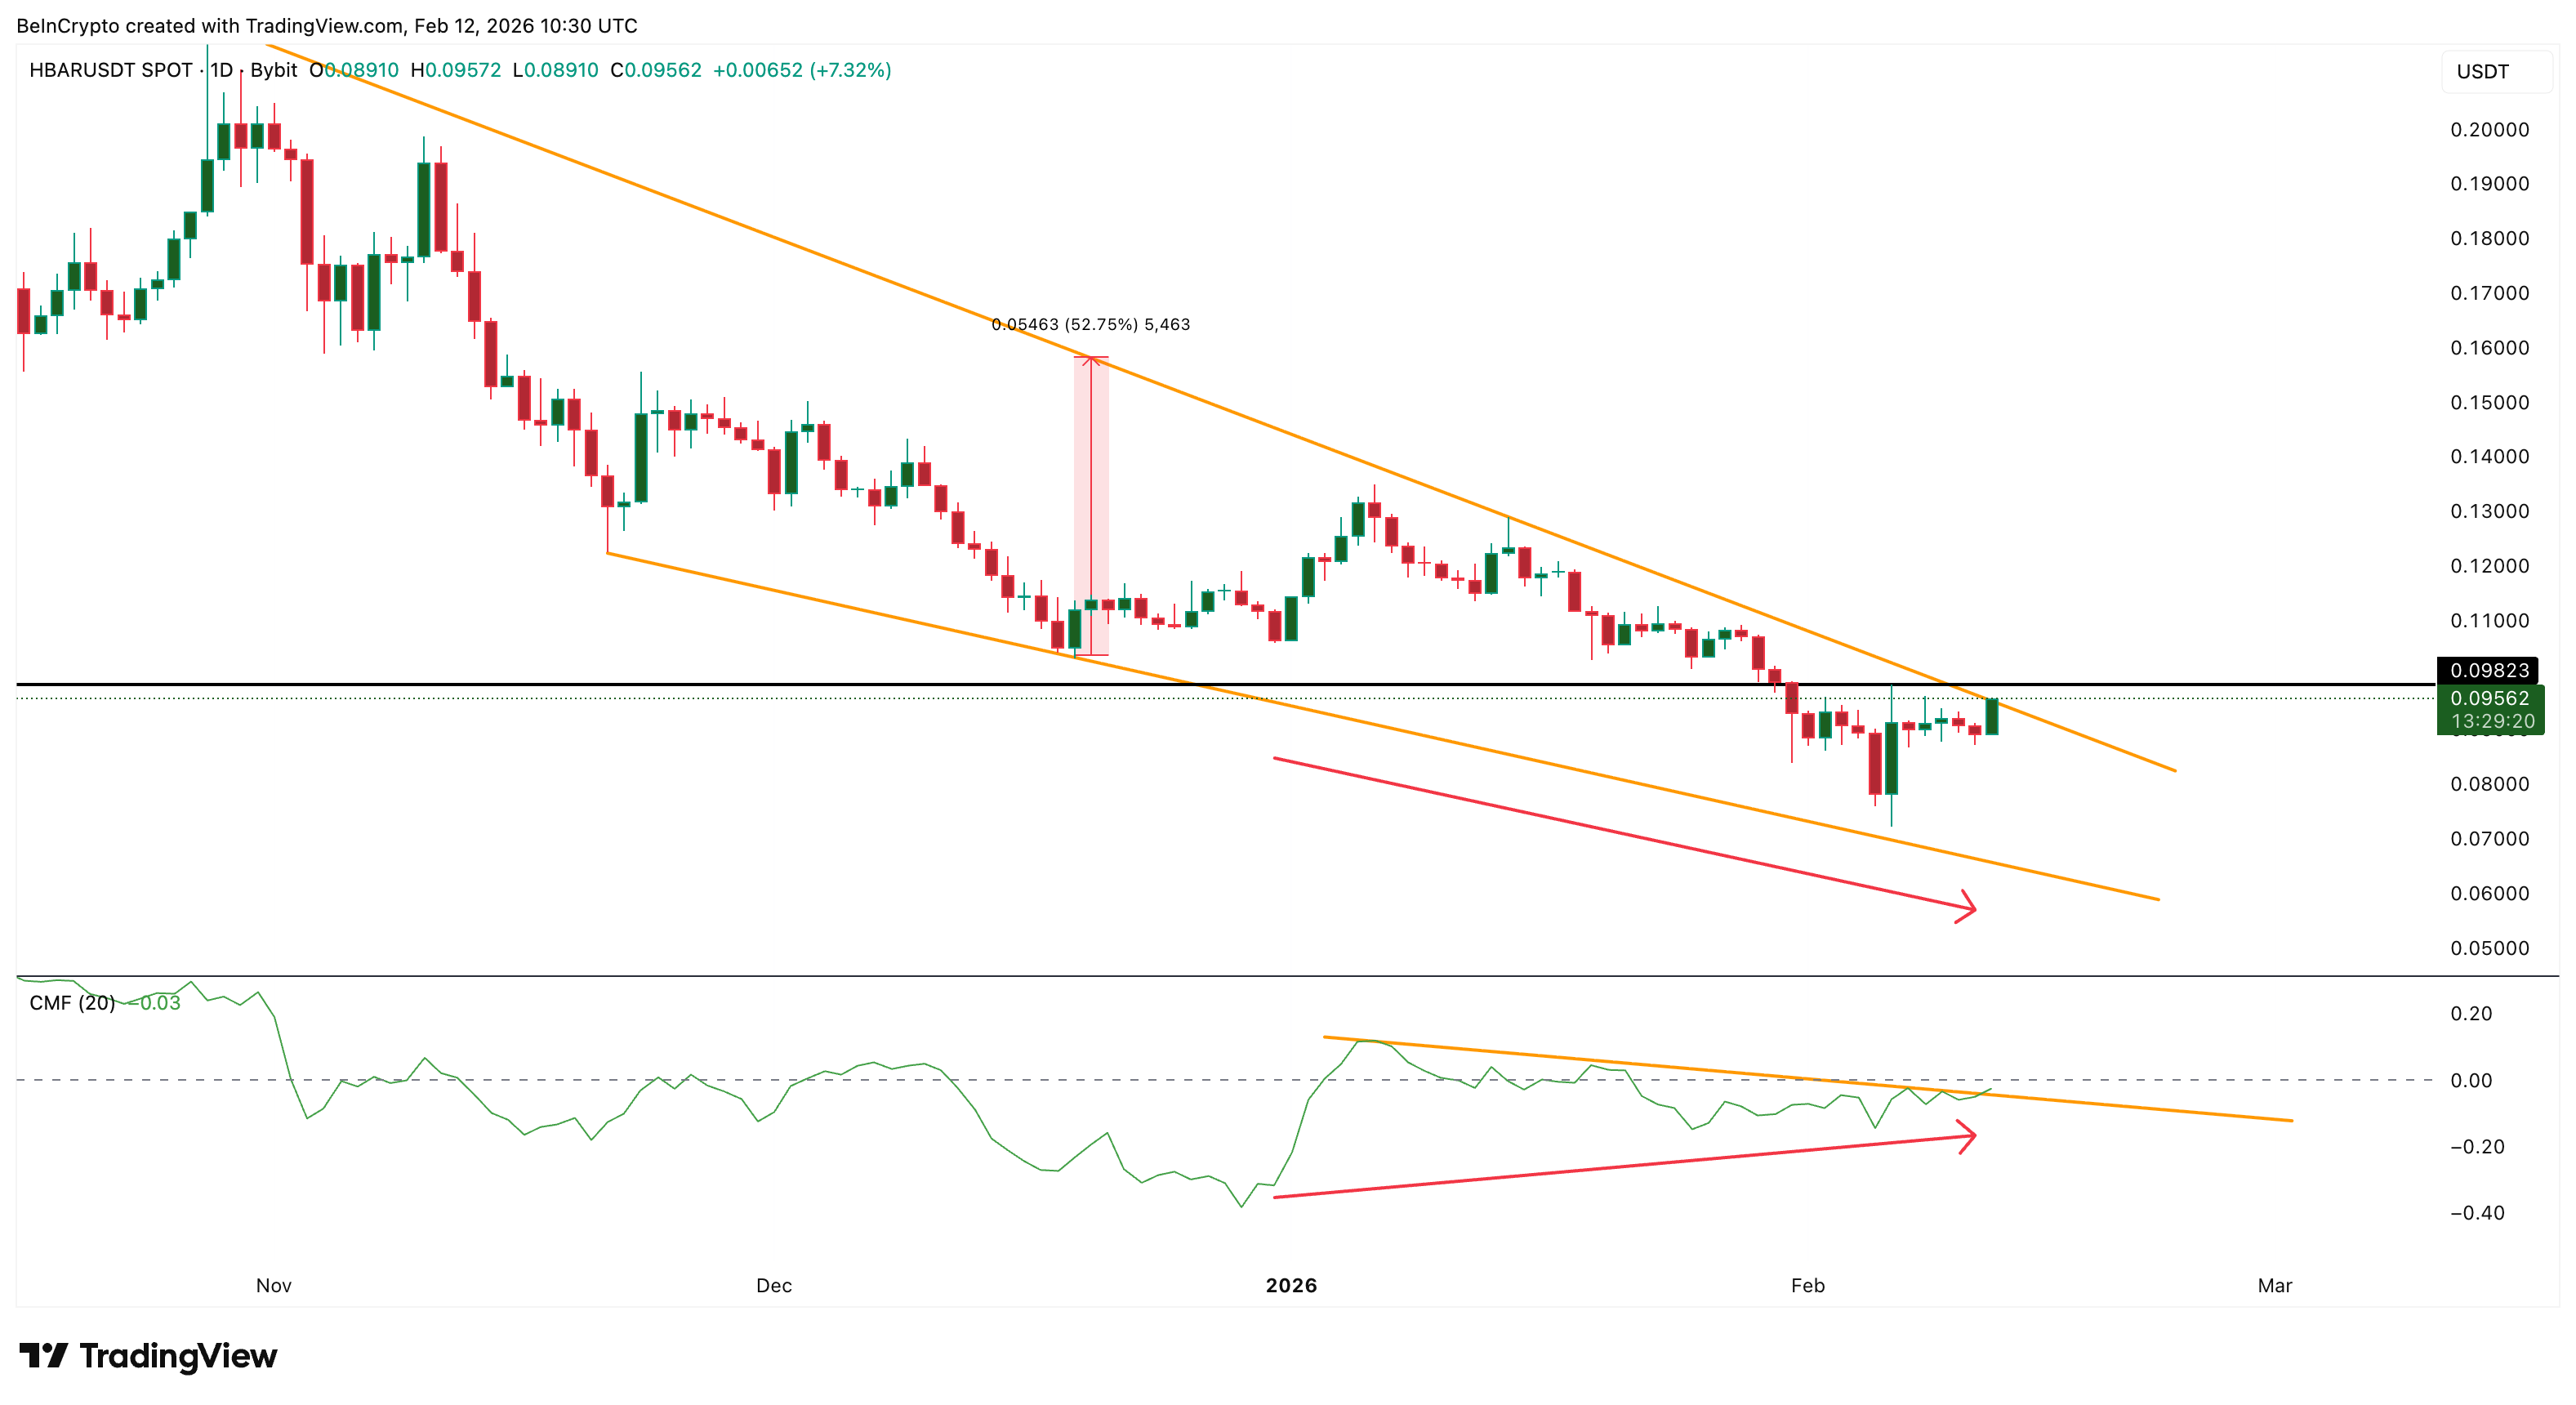
Sponsored
Sponsored
This means selling pressure has eased, but strong accumulation has not returned. The rally is still driven mainly by short-term traders rather than large wallets. Derivatives data adds further risk. Open interest measures the total value of active futures contracts. When it rises, leverage in the market increases.
Since February 11, HBAR’s open interest has climbed from about $26.96 million to nearly $29.38 million, an increase of roughly 9% in one day. This jump happened as the price approached resistance. At the same time, funding rates turned sharply positive.
Funding shifted from around -0.018 to near +0.05 within 24 hours. This shows that long positions are building rapidly. There is also a divergence between price and leverage.
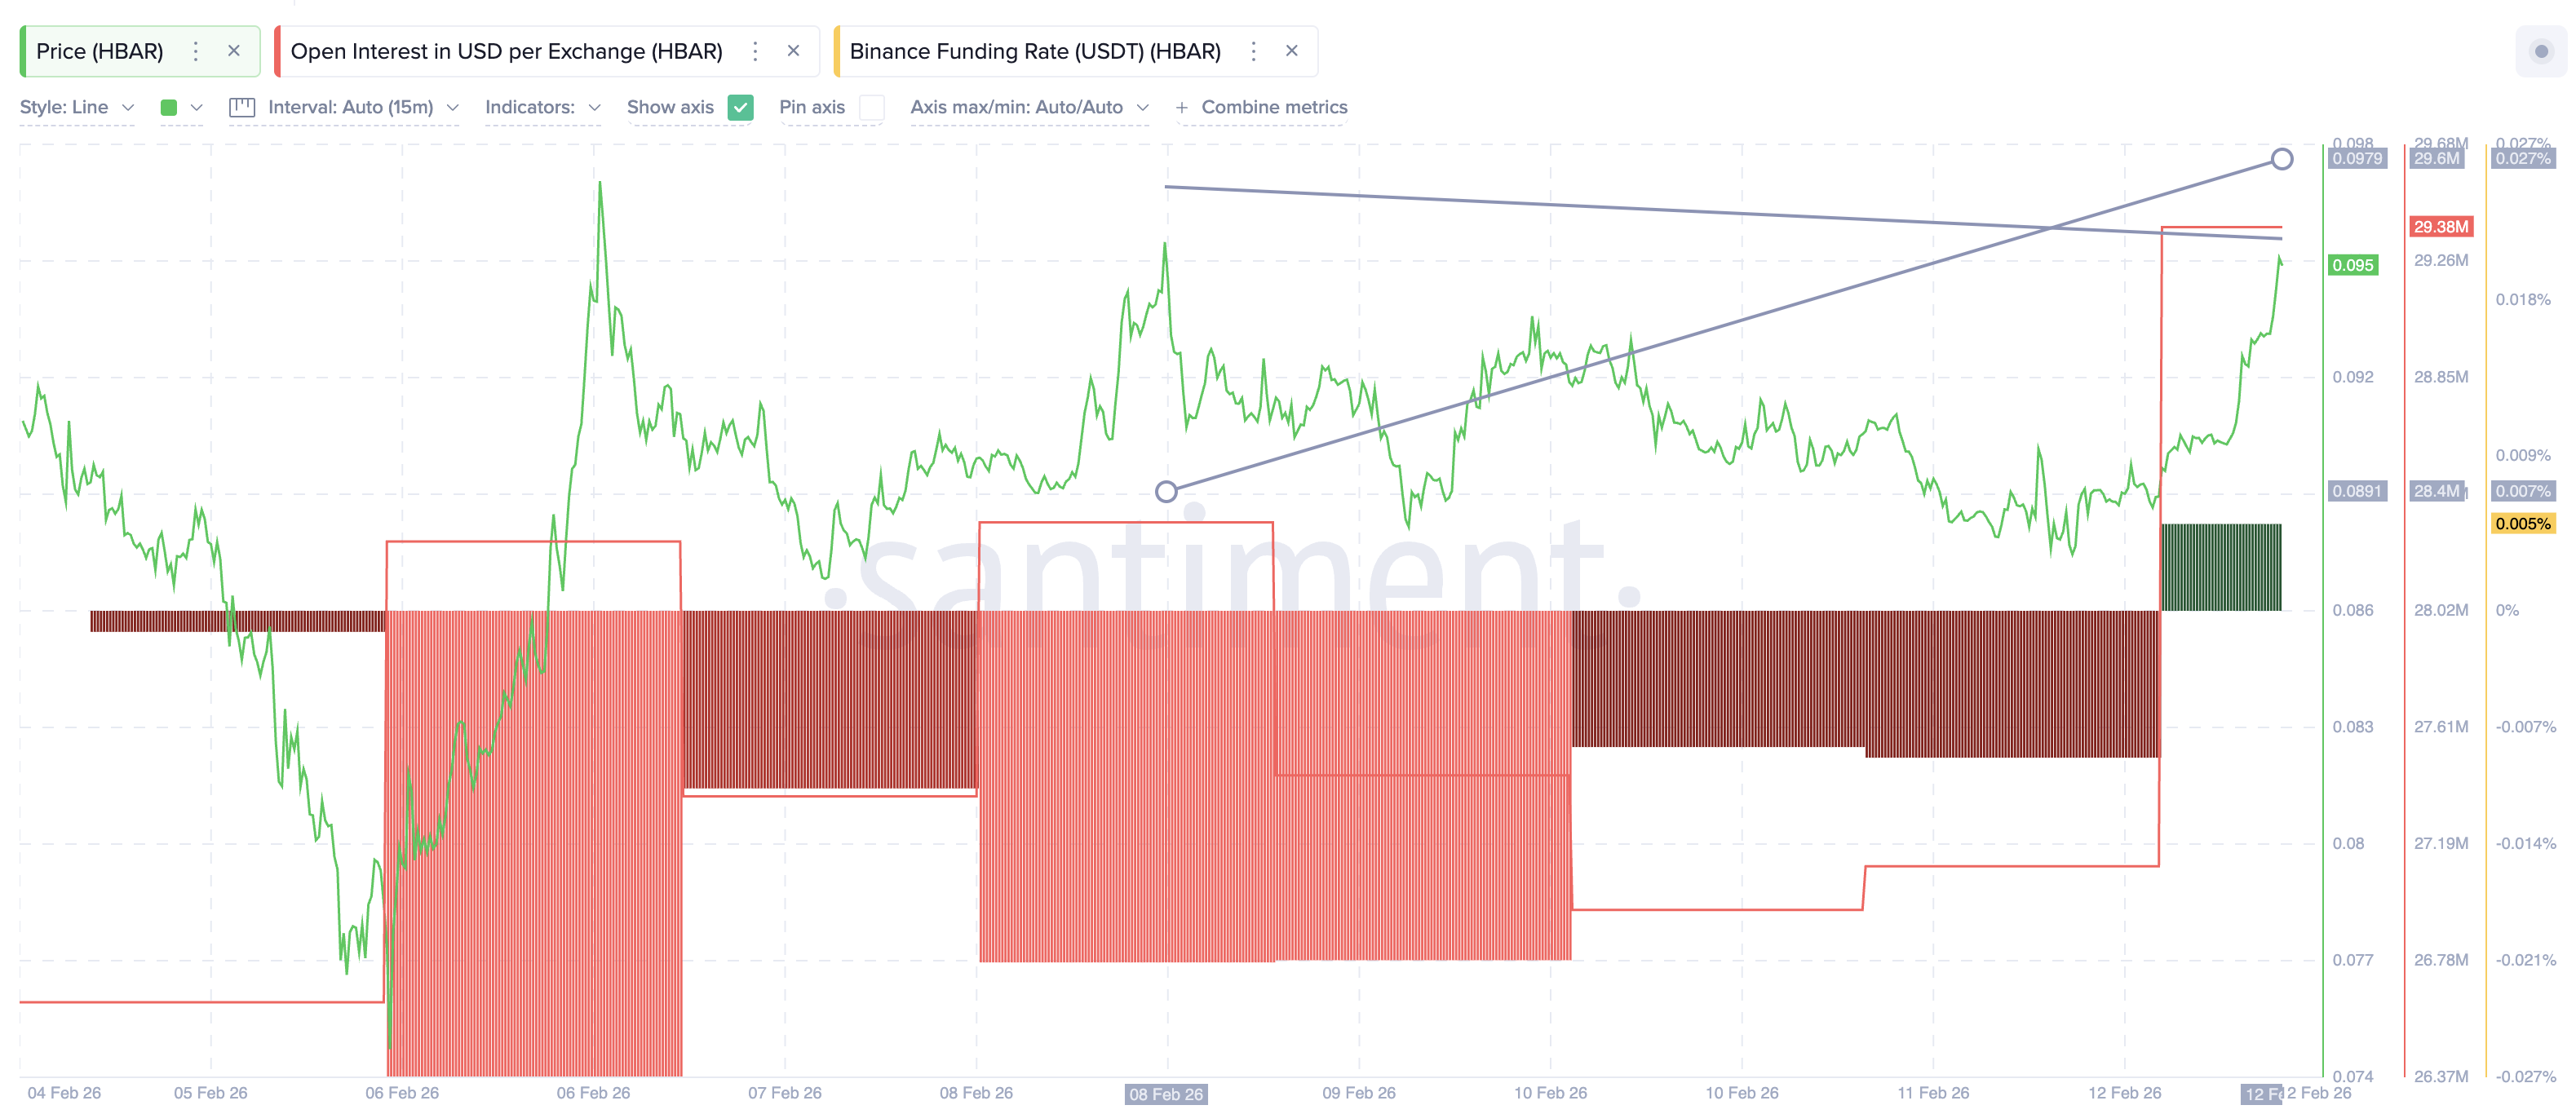
The HBAR price formed a local peak on February 8 and another on February 12. The second peak is lower, showing weaker price strength. But open interest made a higher high during the same period. More leverage is entering the market even as the price momentum weakens. This combination often precedes pullbacks. When leverage rises near resistance and momentum fades, even small declines can trigger forced liquidations.
In simple terms, risk-taking is rising while conviction remains weak.
Sponsored
Sponsored
Key Levels Will Decide Whether HBAR Price Breaks Out or Pulls Back
With optimism clashing with weak participation, price levels now matter most. The main upside trigger remains $0.098.
This level aligns with wedge resistance and recent swing highs. A clean break and hold above it would invalidate the bearish divergence and reduce liquidation risk. If that happens, HBAR could target $0.107 first, followed by the $0.145 zone, potentially realizing the wedge target.
That would confirm that real demand has returned. Until then, the rally remains vulnerable. On the downside, $0.090 is the first key support. This level has held multiple times during recent consolidation. A breakdown below it would likely trigger long liquidations.
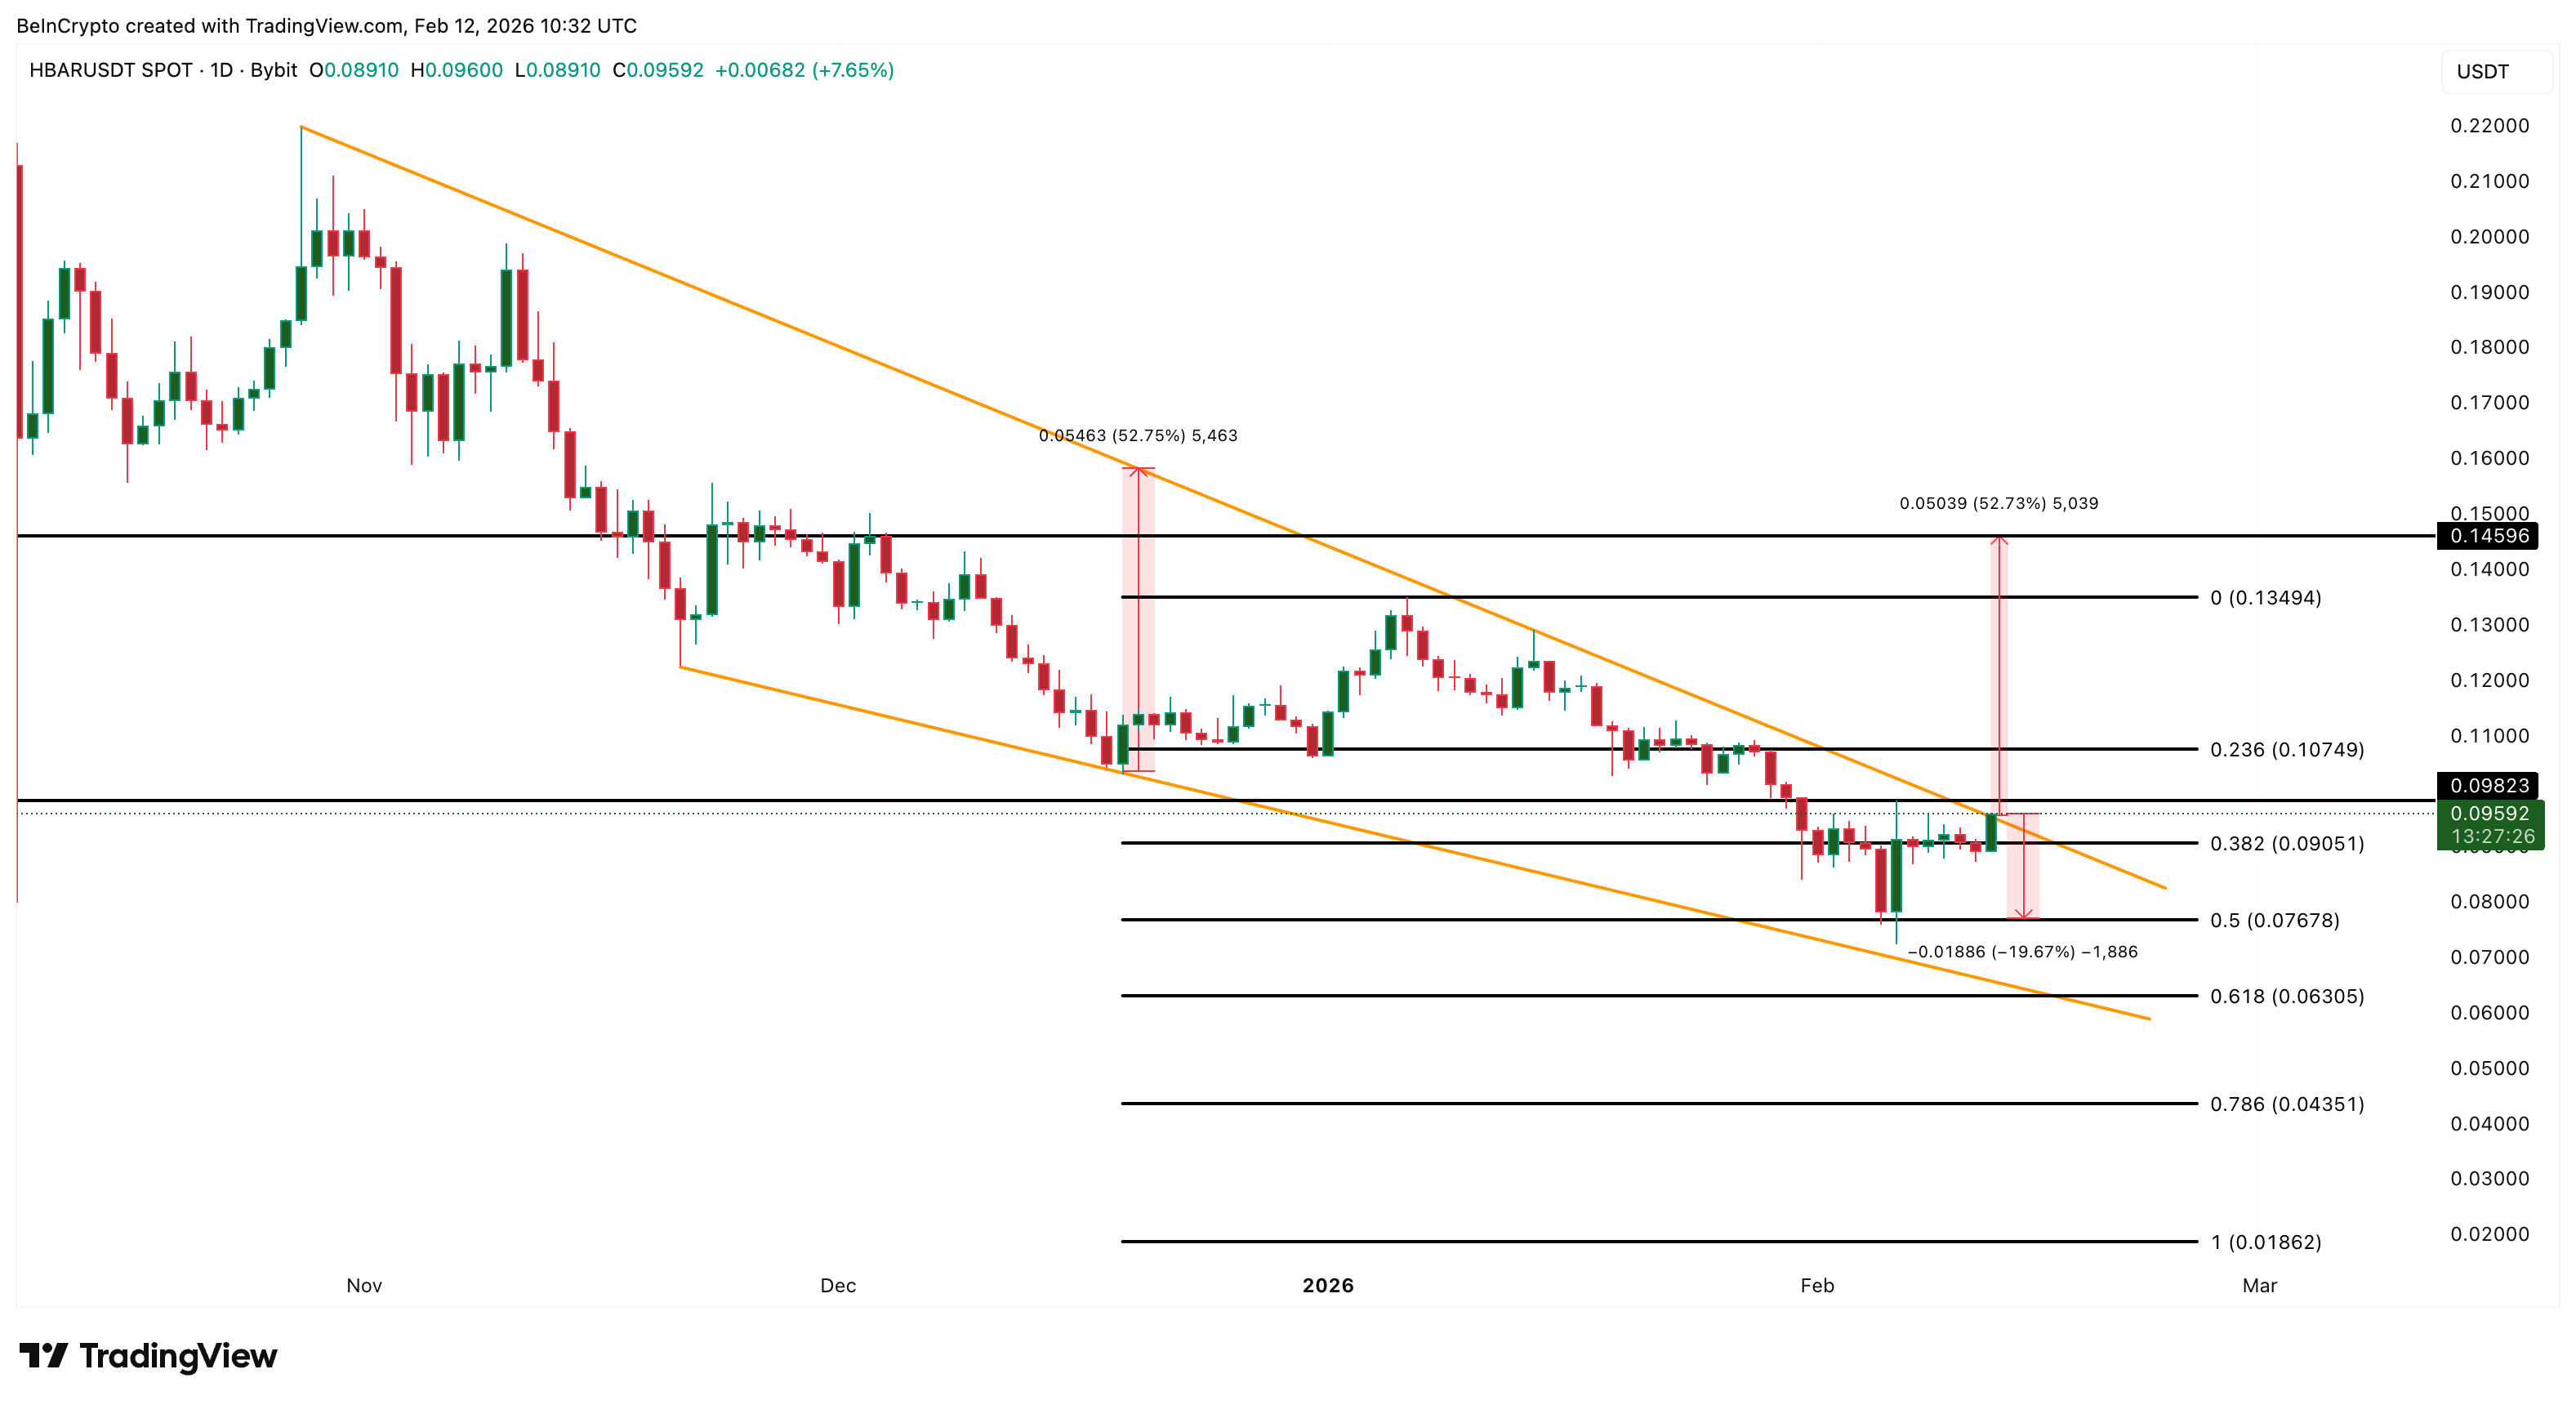
Below $0.090, the next major support sits near $0.076. A move to this zone would erase around 20% from current levels and signal that the breakout attempt has failed.