


The Ethereum price has slipped below an important support zone, putting short-term momentum under pressure. After climbing to an intraday high near $1,987, ETH pulled back toward the $1,935 region, showing that sellers are still active at higher levels. The drop may not look dramatic, but losing this support shifts the tone of the market.
At the same time, whale activity has picked up, and staking continues to edge higher, hinting that larger holders are not stepping away. This creates a mixed setup: short-term weakness versus longer-term confidence. Ethereum now sits at a crucial point where the next move could define the broader trend.
Ethereum Whale Accumulation and Staking Signal Long-Term Confidence
Recent on-chain data shows Ethereum flowing steadily into accumulation addresses, even as the ETH price pulls back from local highs. Large holders appear to be moving coins into long-term wallets rather than sending them to exchanges, which typically signals accumulation instead of distribution. Historically, this kind of whale behavior has emerged during cooling phases, when short-term sentiment weakens, but long-term conviction remains intact.
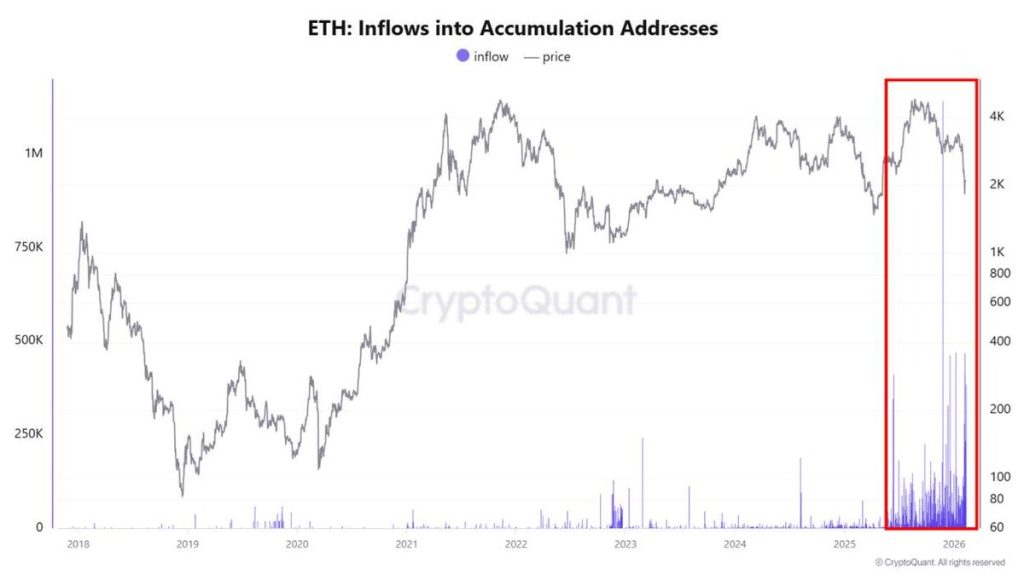
At the same time, Ethereum staking continues to reach significant milestones. More than 30% of the total ETH supply is now actively staked, with tens of millions of coins locked in validator contracts. This reduces the liquid supply available for trading and strengthens overall network security. When whale accumulation aligns with rising staking participation, it suggests growing structural confidence in Ethereum’s long-term value. While price action may look uncertain in the short term, the underlying fundamentals appear to be quietly strengthening.
ETH Liquidity Clusters Signal Volatility Ahead as Price Nears Key Liquidation Zones
This Coinglass liquidation heatmap highlights where leveraged traders are most vulnerable, and those zones often act like price magnets. The thick yellow band around $2,050–$2,120 shows a large cluster of short liquidations. If ETH pushes into this area with momentum, shorts may get forced out, potentially accelerating a quick move toward $2,180–$2,220.
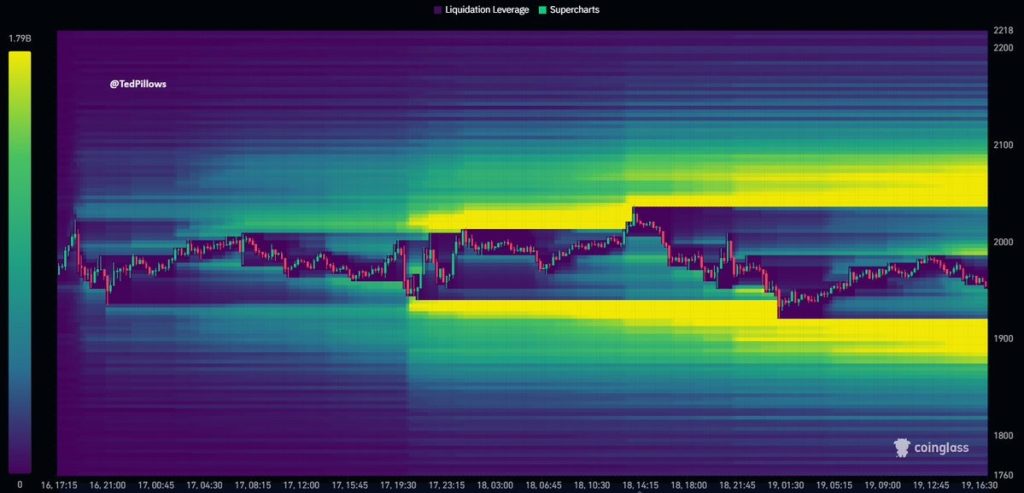
On the flip side, strong liquidity is stacked below the price near $1,900–$1,880, where long positions are heavily exposed. A breakdown into this zone could trigger cascading sell-offs, dragging ETH toward $1,850 or lower. Until one side is cleared, the price is likely to chop between these two liquidation pockets.
What’s Next for the Ethereum (ETH) Price Rally?
Ethereum (ETH) price is losing momentum on the 4H chart as the price slips below the rising trendline that supported the recent structure. This breakdown, combined with repeated rejections near the $2,095–$2,120 supply zone, signals weakening bullish control.
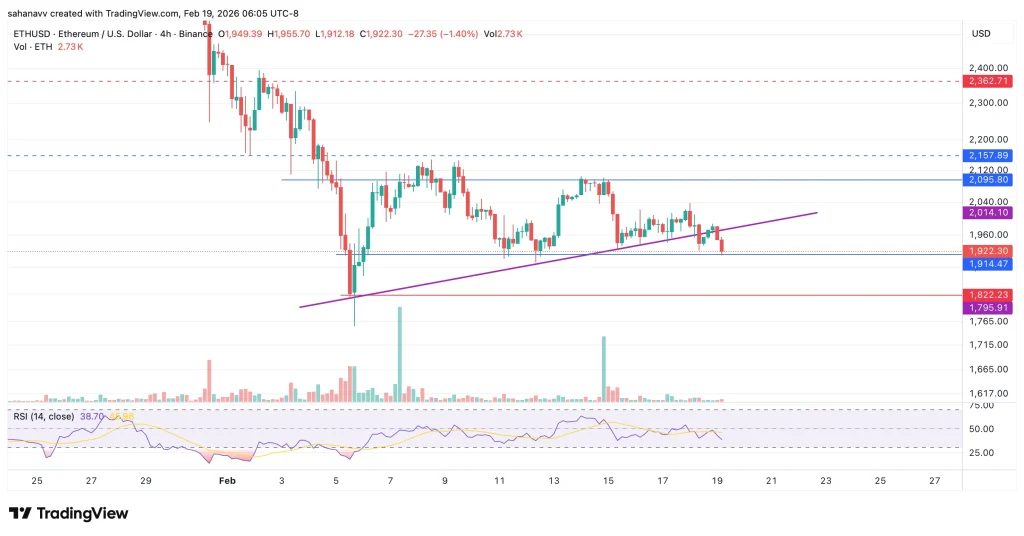
RSI is hovering below the 45–50 zone, showing fading momentum and no strong bullish divergence yet. As long as ETH trades below $2,000, downside pressure remains active. In the near term, price could revisit $1,880–$1,820, which aligns with a key demand zone. A strong reclaim above $2,050 is needed to reopen upside toward $2,150 later this month.
Trust with CoinPedia:
CoinPedia has been delivering accurate and timely cryptocurrency and blockchain updates since 2017. All content is created by our expert panel of analysts and journalists, following strict Editorial Guidelines based on E-E-A-T (Experience, Expertise, Authoritativeness, Trustworthiness). Every article is fact-checked against reputable sources to ensure accuracy, transparency, and reliability. Our review policy guarantees unbiased evaluations when recommending exchanges, platforms, or tools. We strive to provide timely updates about everything crypto & blockchain, right from startups to industry majors.
Investment Disclaimer:
All opinions and insights shared represent the author’s own views on current market conditions. Please do your own research before making investment decisions. Neither the writer nor the publication assumes responsibility for your financial choices.
Sponsored and Advertisements:
Sponsored content and affiliate links may appear on our site. Advertisements are marked clearly, and our editorial content remains entirely independent from our ad partners.