


BNB has been one of the strongest large-cap performers lately, breaking above the $1,340 mark to reach a new all-time high a few hours back. The BNB price is still up 3.3% in the past 24 hours at press time and more than 27% over the last seven days.
However, it has cooled about 3.4% from that recent high. The charts now suggest that this pullback might extend a little further — but that may not be a bad thing. In fact, it could be what BNB needs to build strength for the next leg higher.
Sponsored
Sponsored
Previous Fractal and Unrealized Profits Hint at a Healthy BNB Cooldown
BNB’s current 12-hour chart appears to be replaying an earlier breakout setup — a bullish flag-and-pole fractal that led to a 28% rally earlier in the cycle. In that previous structure, the BNB price first rallied sharply from $840 (point A) to $1,080 (point B), then corrected about 13.9% down to $930 before continuing higher to $1,270 and beyond.
Now, a nearly identical pattern has taken shape again. The new “pole” runs from A1 to B1, peaking at around $1,340. The next stage — the “flag” — typically involves a mild cooldown before another breakout.
Want more token insights like this? Sign up for Editor Harsh Notariya’s Daily Crypto Newsletter here.
This expected BNB price correction is further backed by bearish RSI divergence. On the 12-hour chart, while price made a higher high, the Relative Strength Index (RSI) — a measure of momentum — made a lower high. Such divergence usually signals that buying momentum is slowing, making a short-term pullback likely.
While this kind of divergence usually signals trend reversal on the higher timeframe, on the 12-hour chart, it could mean a healthy BNB price pullback.
Sponsored
Sponsored
Adding to that, the short-term holder NUPL (Net Unrealized Profit/Loss) has jumped from 0.128 on September 25 to 0.345 as of October 7 — its highest level this year and a 170% surge. Rising NUPL (currently at the highest yearly levels) means more traders are sitting on unrealized gains, often marking local tops.
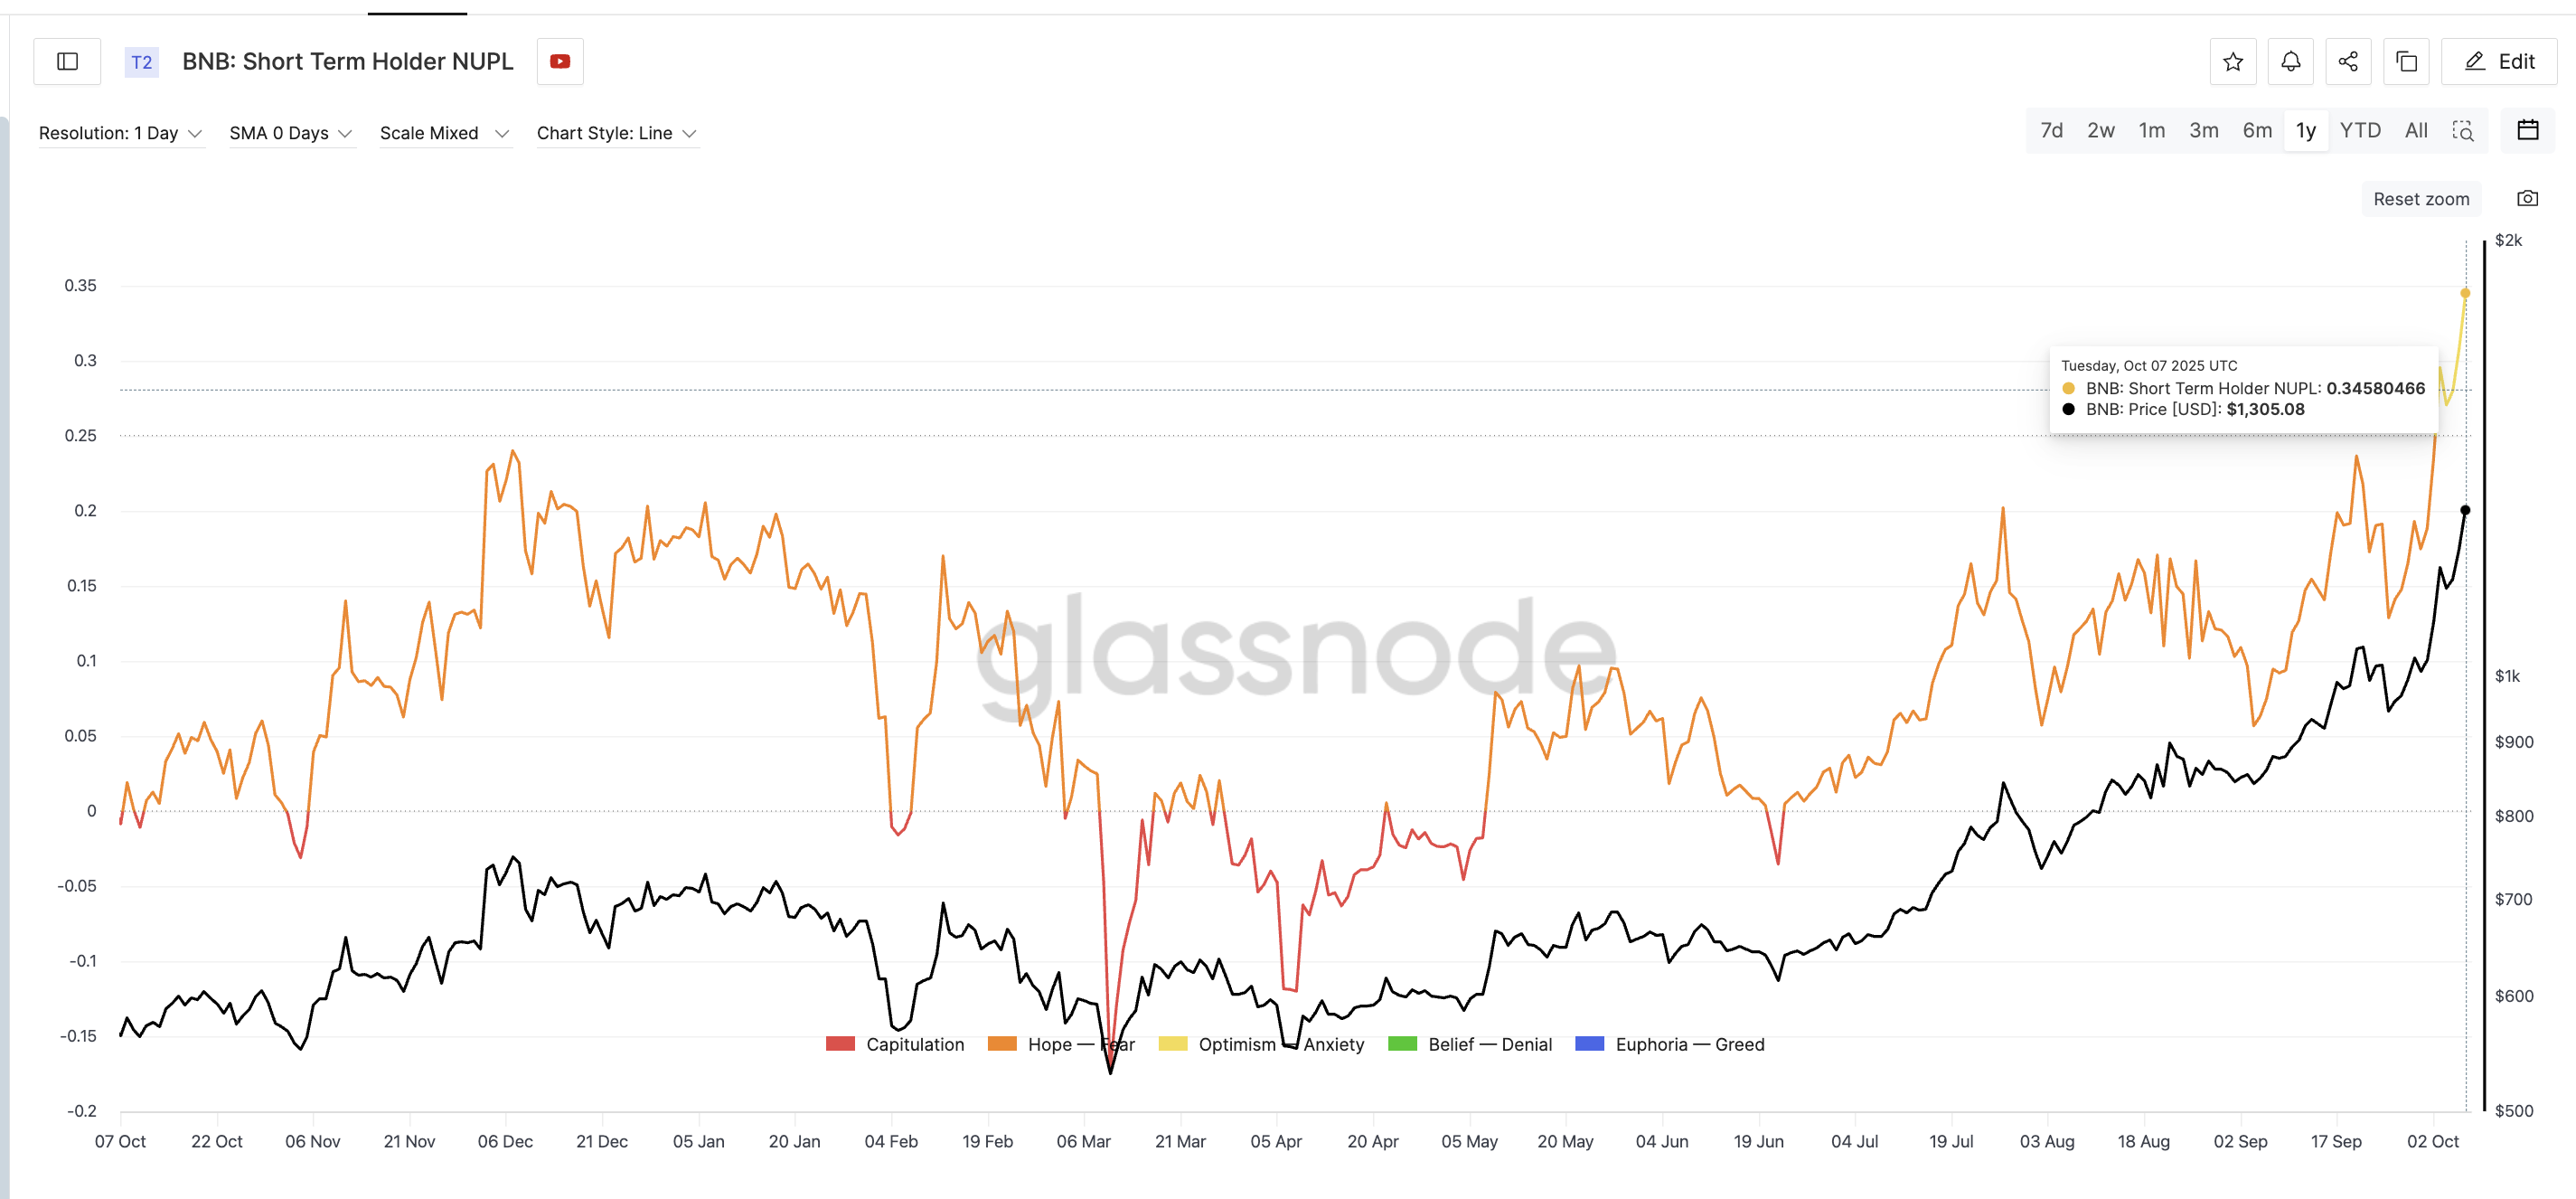
A similar NUPL spike on July 27, 2025, preceded a 13% correction, validating the probability that another 13%-14% drop could play out to complete the flag portion of this fractal.
BNB Price Levels to Watch as Pullback Looks Likely
If the BNB price pattern holds, a pullback toward $1,190–$1,130 would match the depth of the previous correction. This zone aligns with key Fibonacci levels, making it a strong area for bulls to reenter. That would also complete the bull flag formation, as mentioned previously in our fractal analysis.
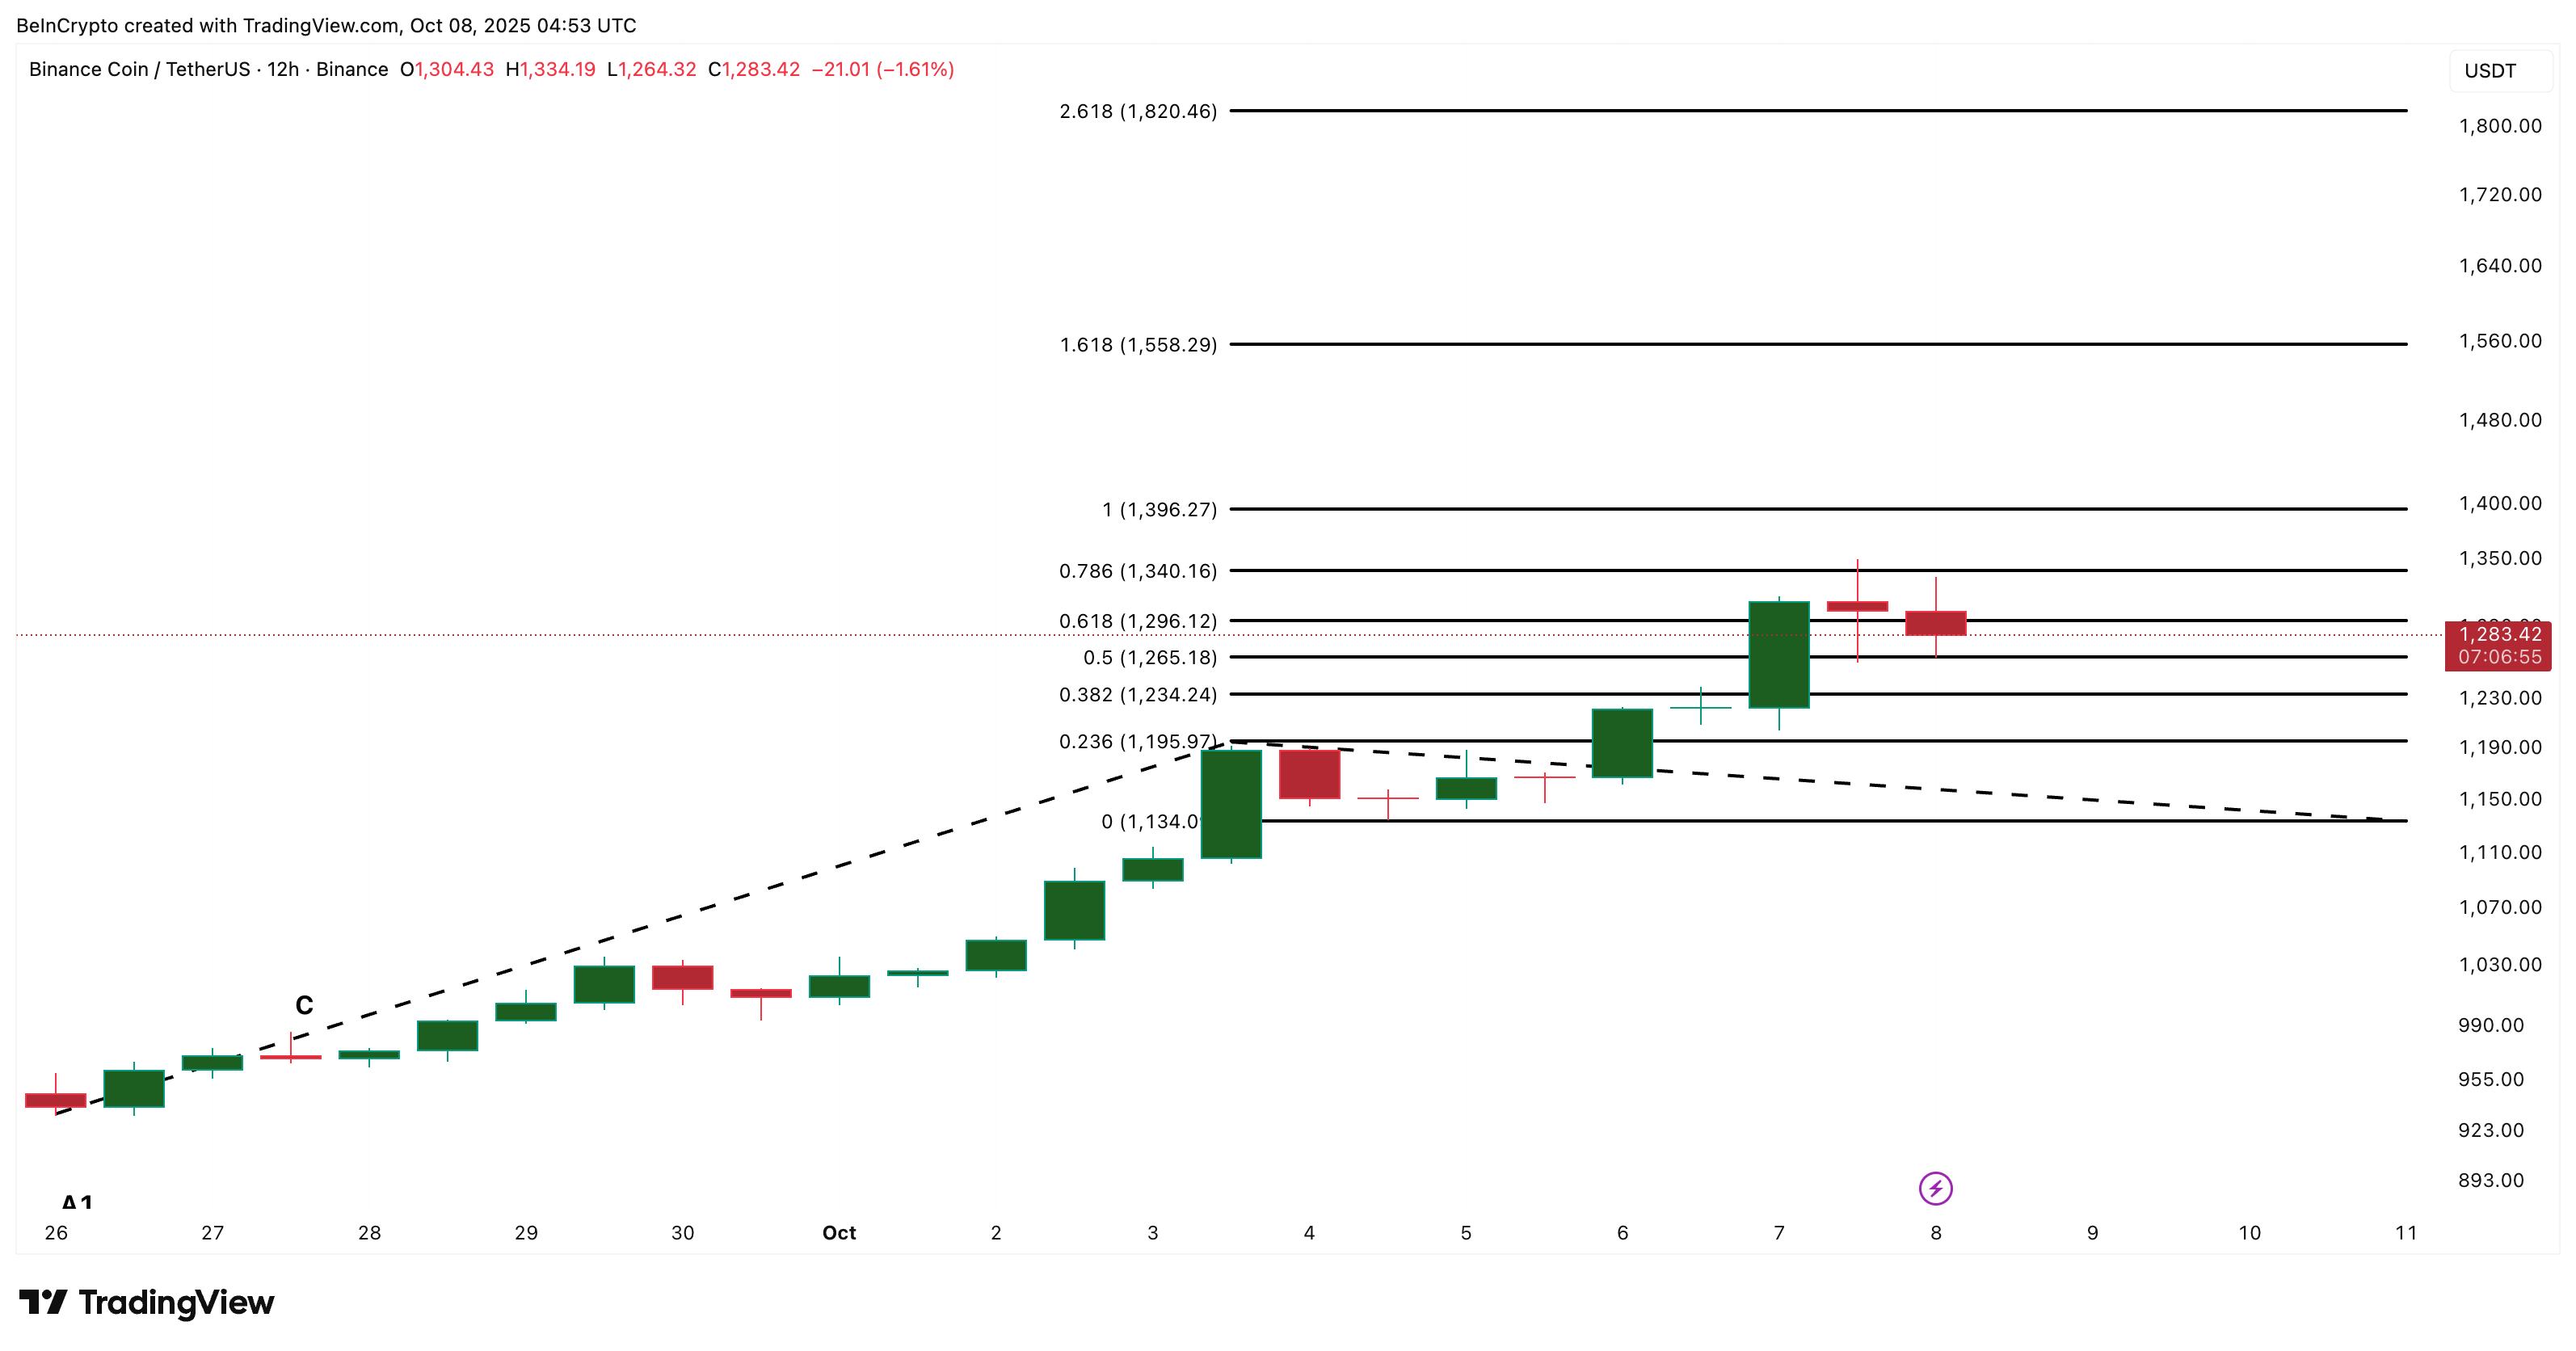
From there, a bounce could target $1,550 (1.618 extension) and $1,820 (2.618 extension), both derived from the same trend-based Fibonacci projection used in the previous cycle.
If the BNB price closes a 12-hour candle below $1,130, the continuation thesis would weaken, and deeper losses could follow.
For now, both chart structure and on-chain data suggest that a short-term dip might not be a threat — it might be BNB’s next launchpad.