


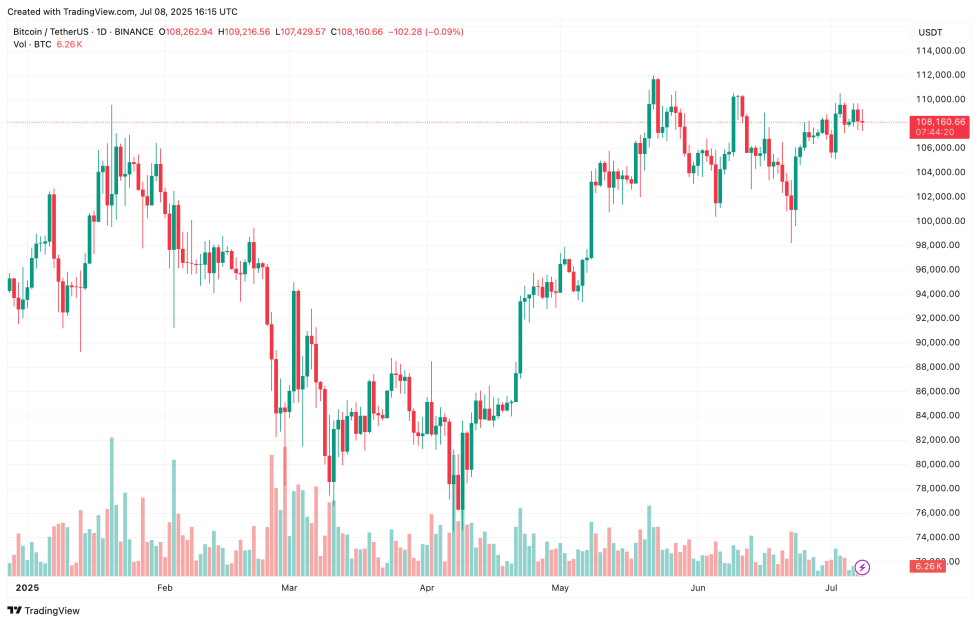
Over the past week, Bitcoin (BTC) has been seesawing within a narrow price range of $107,000 to $110,000, offering little clarity on the direction of its next major move. However, the latest technical analysis suggests that the flagship cryptocurrency may be on the verge of a breakout to the upside, potentially eyeing a new all-time high (ATH).
Bitcoin Set To Clear Descending Broadening Wedge
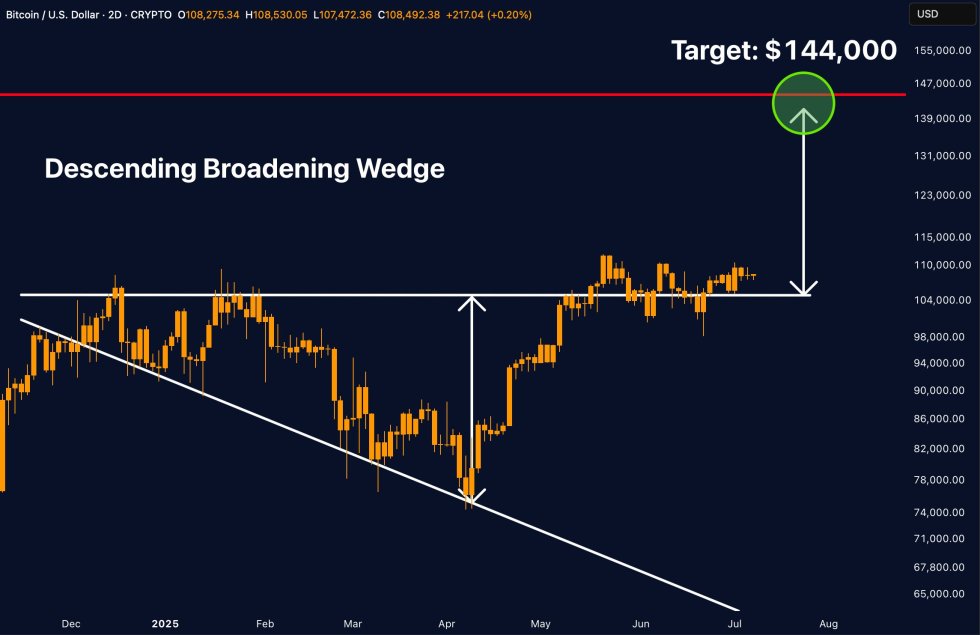
According to a recent X post by crypto trader Merlijn The Trader, Bitcoin appears poised to break out of a bullish descending broadening wedge pattern. The trader noted that if BTC can sustain support above the $104,000 level, it may target a potential high of $144,000.
For the uninitiated, a descending broadening wedge is a bullish chart pattern formed by two diverging trendlines sloping downward, where price makes lower highs and lower lows over time. It suggests growing volatility and selling exhaustion, often leading to a breakout to the upside once resistance is broken.
The following two-day chart shows BTC adhering to this pattern since early January 2025. A significant reversal occurred in April, when Bitcoin surged from a local low of around $76,000 to over $100,000 in just a few weeks.
Meanwhile, fellow crypto analyst Ted Pillows shared a similar outlook. He shared the following weekly BTC chart, noting that Bitcoin just posted its highest-ever weekly close. He also highlighted that the Moving Average Convergence Divergence (MACD) indicator has formed a bullish cross – similar to the setup in Q4 2024.

To explain, MACD bullish cross occurs when the MACD line – short-term moving average – crosses above the signal line – longer-term moving average – signaling a potential shift from bearish to bullish momentum. This crossover is often seen as an early indicator of a price uptrend or buying opportunity.
Bitcoin experienced strong price appreciation in Q4 2024, climbing from approximately $58,000 on October 6 to $108,000 by December 15. At the time, the rally was also fueled by renewed market optimism following Republican candidate Donald Trump’s victory in the US presidential election.
BTC Price May Stall Temporarily
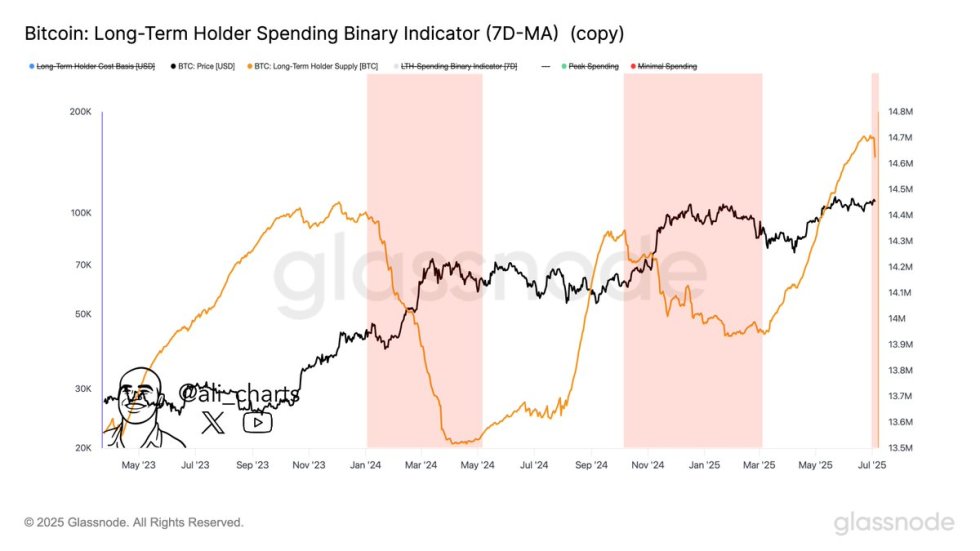
While Bitcoin seems poised to set new ATHs in the near term, some analysts caution that a short pause in the uptrend may occur. For instance, seasoned analyst Ali Martinez observed that some long-term holders are beginning to take profits.
Similarly, strong US employment data for June 2025 is likely to force the US Federal Reserve (Fed) to delay interest rate cuts, which may result in a temporary price pullback in risk-on assets, including BTC.
That said, Bitcoin’s weekly RSI continues to trend upward, offering bulls hope that a new high may be within reach. At press time, BTC is trading at $108,160, down 0.1% over the past 24 hours.
Featured image from Unsplash.com, charts from X and TradingView.com

Editorial Process for bitcoinist is centered on delivering thoroughly researched, accurate, and unbiased content. We uphold strict sourcing standards, and each page undergoes diligent review by our team of top technology experts and seasoned editors. This process ensures the integrity, relevance, and value of our content for our readers.