


I’m witnessing a dynamic shift in Hyperliquid’s price action that’s grabbing trader attention and headlines alike. Over the past day, HYPE price jumped 1.95% to $48.24, capping an impressive weekly run of 22.93%. Wondering what led to the moonish move? The surge isn’t just technical, it’s supported by two pivotal ETF filings by 21Shares and Bitwise.
Successively, against the backdrop of an altcoin season, liquidity is rotating rapidly into alts, with HYPE riding a 23.7% 7-day wave that’s hard to ignore. Giving a gist about technicals, the price closed decisively above the 7-day SMA at $44.78 and 30-day SMA at $42.5. With a market cap now at $16.24 billion, HYPE’s rise stands out not just in technical charts but also in the story told by its numbers.
HYPE Price Analysis
Right now as I write this analysis, HYPE price is at $48.34, above significant moving averages and with bullish signals flashing in the MACD histogram (1.57). The 14-day RSI reads 60.58, inching closer to overbought territory, suggesting traders may soon start locking in profits if momentum stalls.
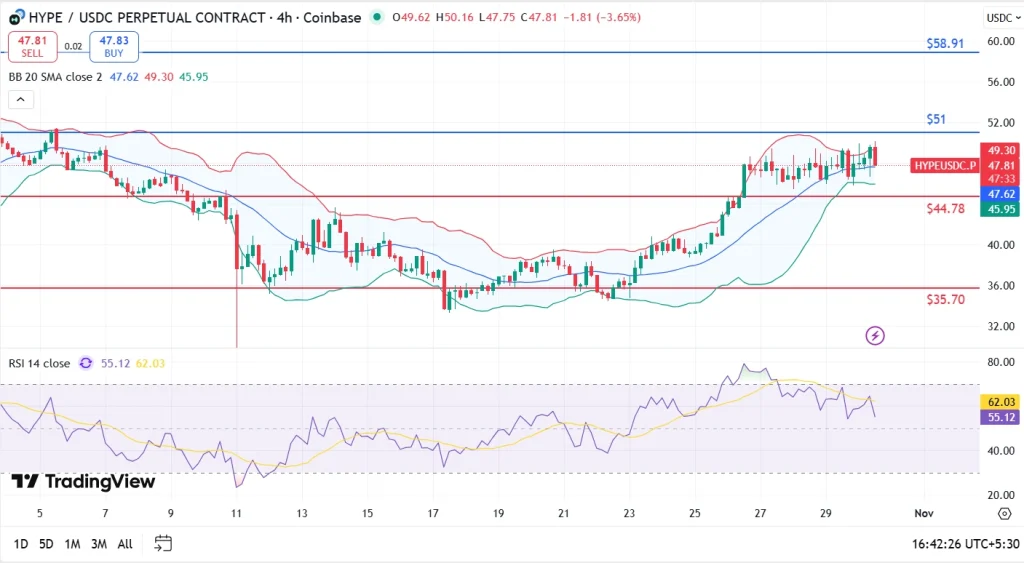
The Fibonacci retracement at $45.42 marks a critical resistance zone, one that’s been tested repeatedly in recent trading sessions. Bulls have controlled the narrative for most of the week, as the price has ranged above the short-term SMA at $44.78. If HYPE falls below its pivot point at $48.07, it may trigger profit-taking and expose the price to a pullback.
FAQs
Recent ETF filings by major issuers, a technical breakout above key moving averages and capital flows into altcoins are the primary drivers right now.
The RSI is approaching the overbought zone, which means buyers may pause or lock in gains soon, so monitoring for potential reversals is important.
If the price dips below the pivot point at $48.07, a wave of profit-taking could drive a short-term correction, especially given the high RSI and recent rally.
Trust with CoinPedia:
CoinPedia has been delivering accurate and timely cryptocurrency and blockchain updates since 2017. All content is created by our expert panel of analysts and journalists, following strict Editorial Guidelines based on E-E-A-T (Experience, Expertise, Authoritativeness, Trustworthiness). Every article is fact-checked against reputable sources to ensure accuracy, transparency, and reliability. Our review policy guarantees unbiased evaluations when recommending exchanges, platforms, or tools. We strive to provide timely updates about everything crypto & blockchain, right from startups to industry majors.
Investment Disclaimer:
All opinions and insights shared represent the author’s own views on current market conditions. Please do your own research before making investment decisions. Neither the writer nor the publication assumes responsibility for your financial choices.
Sponsored and Advertisements:
Sponsored content and affiliate links may appear on our site. Advertisements are marked clearly, and our editorial content remains entirely independent from our ad partners.