

On March 31, 2026, Wall Street saw its best trading day in nearly a year. The Dow Jones Industrial Average gained over 1,100 points, the S&P 500 rose 2.9% for its best single-day performance since last May, and the Nasdaq jumped 3.8%.
The mood, as one market recap cheerfully dubbed it, was “Hormuz Hope,” a rally built on the possibility that the US-Iran war and the stranglehold it had on global oil supplies might finally be winding down.
President Trump had signaled openness to ending the military campaign, and Iran’s president said his country had “the necessary will to end the war” if its security conditions were met.
Beneath those headlines, however, the traders who deal in the more complex products of financial markets (the options, the futures, and the hedges) weren’t buying it. While the market might have looked like it was finally stabilizing with upside potential on the surface, the positioning underneath it remained far from certain,
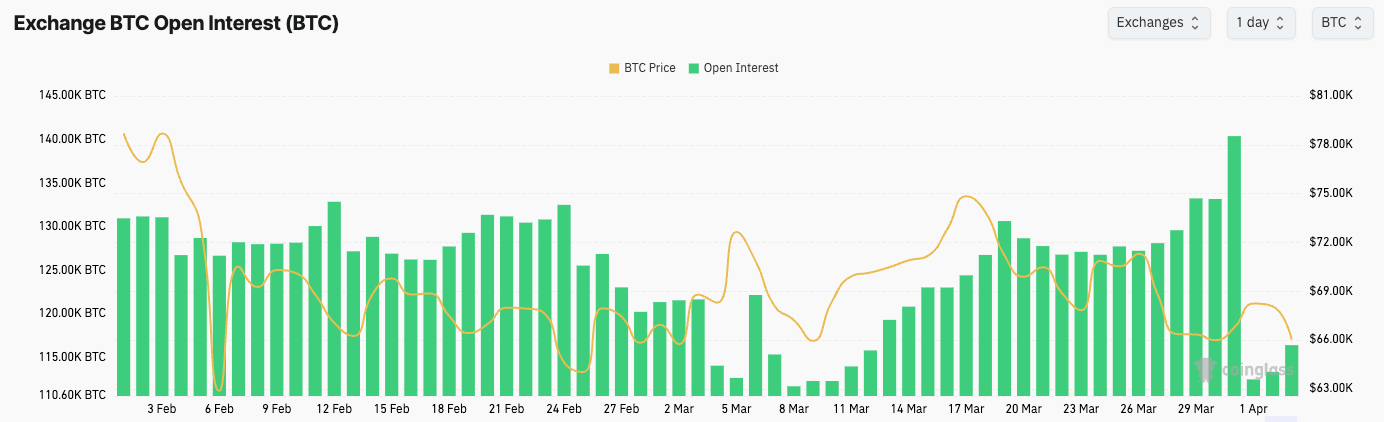
Understanding why requires grasping two straightforward concepts: what “open interest” means, and what it signals when it shrinks. Open interest is simply the total value of bets that remain active in the derivatives market, futures, and options contracts that haven’t been settled or closed. When open interest grows, more traders are putting money to work, expressing conviction about where a market is headed. When it falls, they’re closing their positions, cutting their losses, and stepping away.
Bitcoin’s $46 billion derivatives problem
Bitcoin trades around the clock across hundreds of exchanges around the world, essentially acting as a live barometer of global risk appetite, and right now that barometer is giving an ambiguous reading.
The total open interest in Bitcoin derivatives sits at roughly 703,940 Bitcoin, or about $46.85 billion in notional value, showing a market still loaded with leverage after a period of significant stress. If peace hopes were really returning, confident re-risking would look like traders buying in aggressively. That makes the 4.41% single-day retreat in open interest we’ve seen on Apr. 1 more caution than conviction.
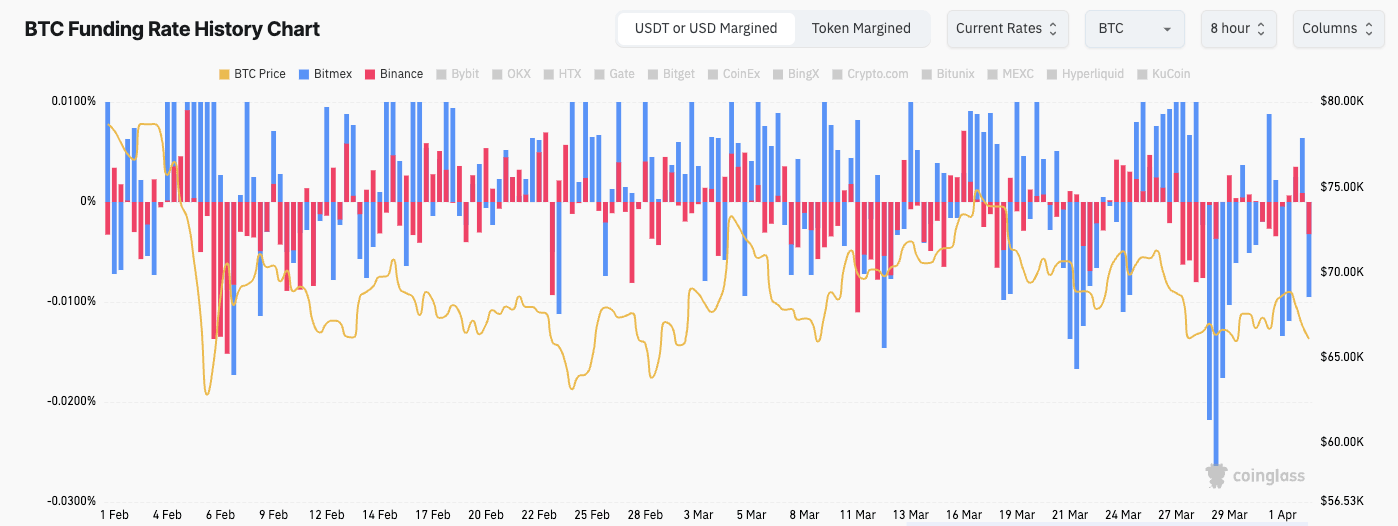
The funding rate, a fee that traders holding bullish positions must pay to maintain them, has been only slightly positive and punctuated by repeated negative dips. When funding rates surge, it signals that bullish sentiment has driven open interest to unsustainable heights, with buyers outnumbering sellers significantly. The muted, flat-to-barely-positive funding Bitcoin has shown in the past two weeks signals a lack of appetite for new risk.
What makes this harder to dismiss as noise is that the institutional presence in Bitcoin derivatives has grown considerably. Of that $46 billion in open interest, more than $7 billion sits on CME, the same regulated exchange where pension funds and sophisticated asset managers do most of their hedging. Rising institutional open interest has established Bitcoin as a mainstream financial instrument, which means the retreat reflects decisions being made in boardrooms and on trading desks, far beyond the speculation of the retail market.
The ratio of options to futures in Bitcoin has also shifted. Earlier this year, options, which act like insurance policies and cushion against sudden price moves, accounted for a far larger share of the Bitcoin derivatives market, but that ratio has since dropped to about 65%, down sharply from highs near 90% last month.
When options exposure shrinks, and futures dominate, the market becomes more directional and less insulated: manageable, until something goes wrong quickly. Data shows particular sensitivity clustered in the $66,000-to-$67,000 price range, a zone where large positions appear concentrated and where a move back into that band could destabilize things rapidly.
Oil options tell the same story
The Strait of Hormuz, the 21-mile chokepoint through which roughly 20% of the world’s daily oil consumption flows, has seen commercial traffic reduced to a trickle since the conflict began. Nearly 17.8 million barrels per day of oil and fuel flows have been disrupted, with close to 500 million barrels of total liquids lost so far, according to Rystad Energy.
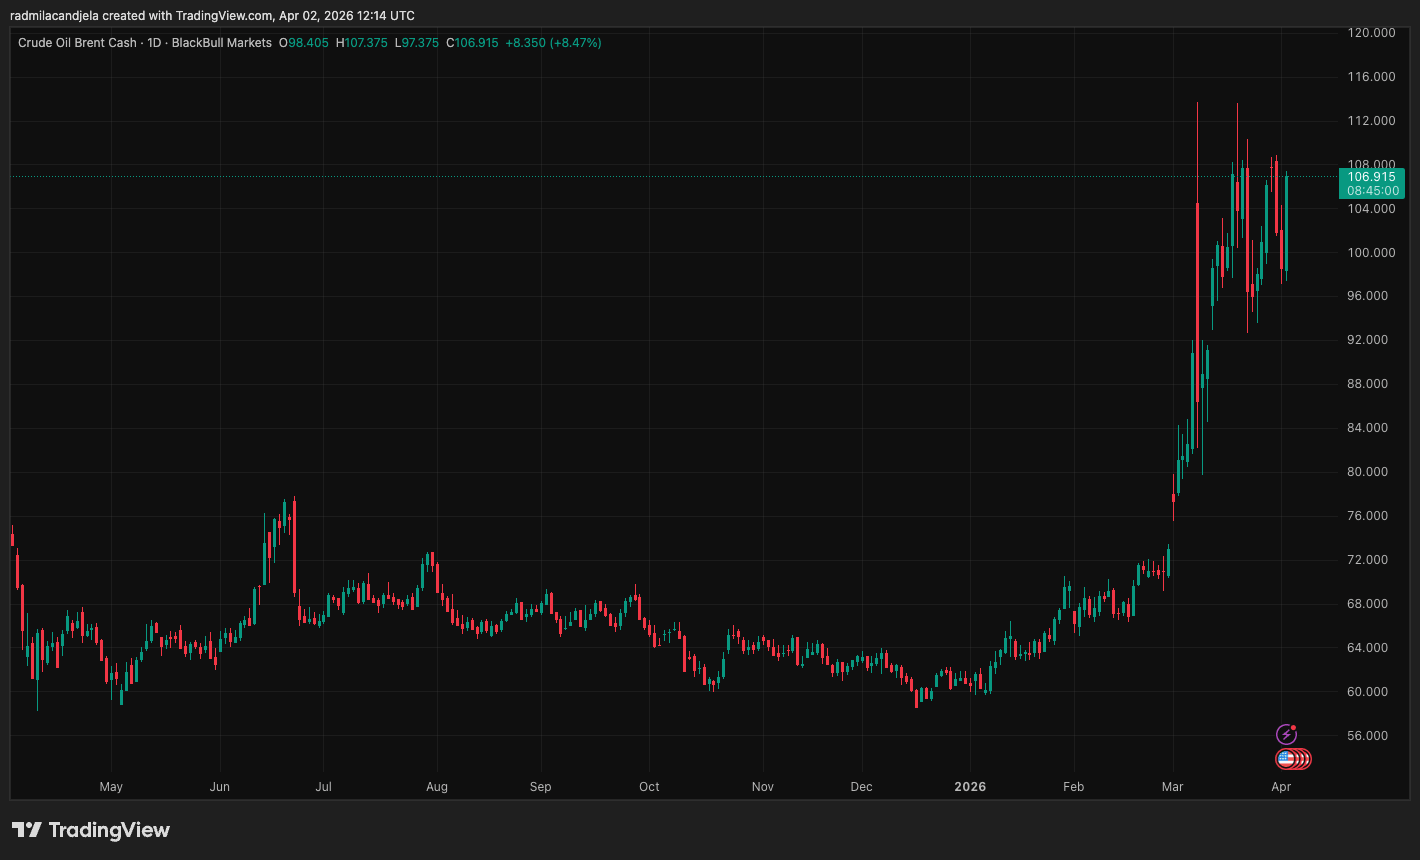
When Brent crude dipped briefly below $100 a barrel on April 1, retreating from highs above $112 just days earlier, markets treated it as confirmation that the worst was behind them.
The options market, however, remained considerably less certain. Ownership of Brent call options betting on crude reaching $150 a barrel by the end of April has risen tenfold in the past month, with open interest in those contracts now standing at nearly 29,000 lots, each representing 1,000 barrels of oil. This is a clear sign that the markets see tail risk outcomes to this conflict.
The largest concentration of open interest remains in $100 call options, the kind of positioning that reflects a market still hedging for further upside shock rather than celebrating an all-clear.
deVere CEO Nigel Green explained the underlying concern:
“Brent at $115 is being treated as a spike. The data tells a different story. Prices are up close to 60% in a single month, options markets are actively pricing scenarios of $150 oil, and up to 20% of global supply has been disrupted through the Strait of Hormuz. Those are not conditions associated with a short-lived shock.”
That view finds an uncomfortable echo in the diplomatic record itself. Trump said Iran had asked for a ceasefire; Iran’s foreign ministry called the claim “false and baseless.” With two governments offering irreconcilable accounts of the same negotiation across the same chokepoint, the market rallied on the more optimistic version while the hedges continued pricing both.
The result is a gap that’s simple but consequential. Stocks are cheering a ceasefire framework that remains unconfirmed, Bitcoin open interest is shrinking when it should be rebuilding, and oil options are still pricing meaningful probability for another energy spike.
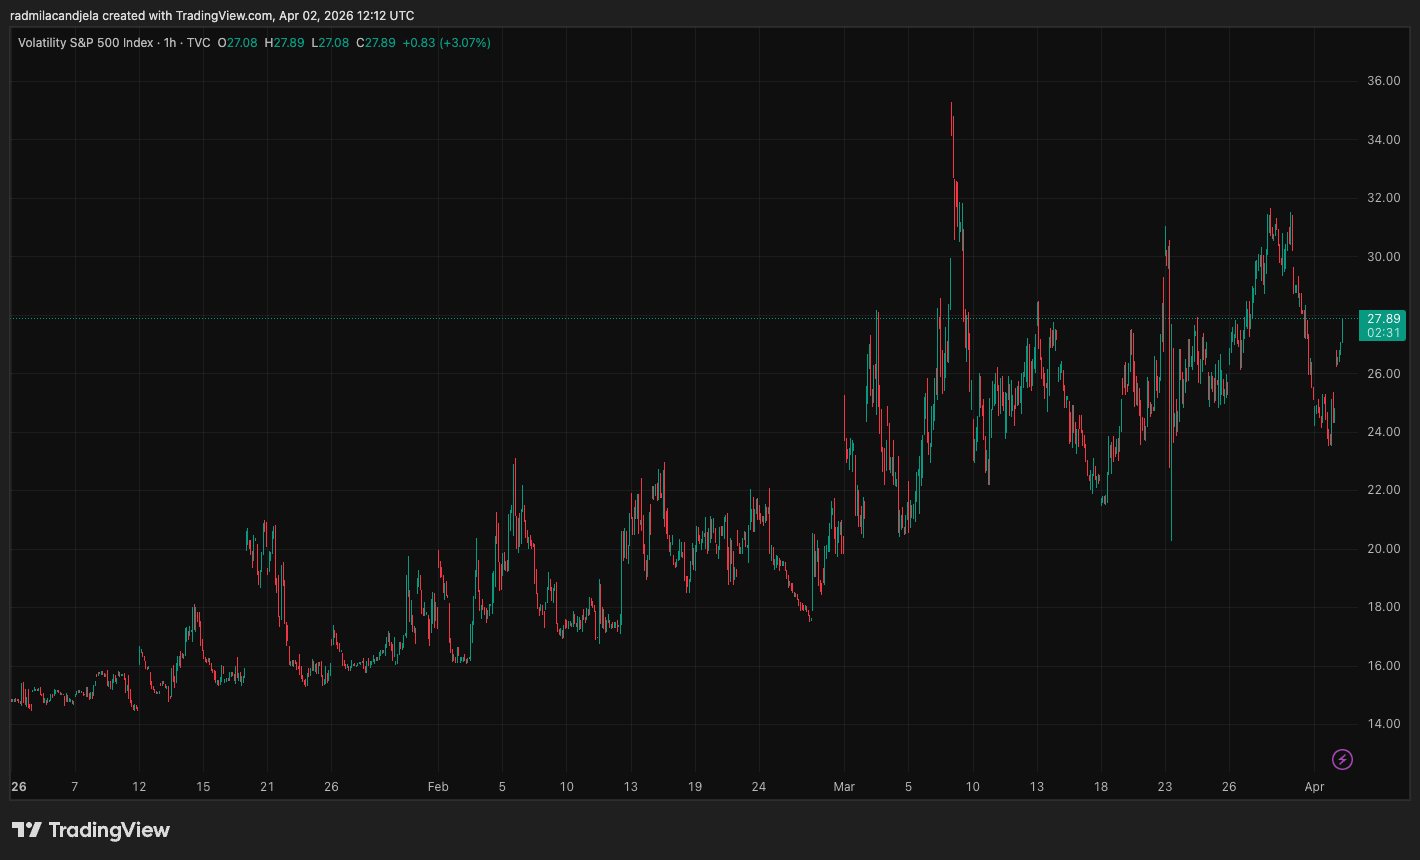
The VIX, Wall Street’s own fear gauge, dropped but held at 24.54, a level that still shows elevated anxiety. Markets are generally skilled at pricing the future they want, but the derivatives underneath them tend to price the future they fear, and right now those two futures look quite different.
The rally has calmed the headlines without cleaning up the positioning, and if the ceasefire unravels, Bitcoin and oil will likely be among the first places it becomes obvious.