

The Bitcoin price rebounded from the local lows around $65,000 and began the weekly trade on a bullish note. Currently, the price has surged close to $67,500, forming an intraday high at $68,408 as market pressure has been fading since yesterday. The price continues to trade within a rising channel structure but seems to have remained stuck within a compression phase as bulls & bears struggle to establish control.
This tightening range often precedes a volatility expansion, and hence, the next upcoming BTC price action may be extremely crucial.
Whale vs Retail Activity Signals a Quiet Accumulation Phase
The chart highlights Bitcoin’s spot average order size, a key metric used to identify whale vs. retail trading behavior in the market. Green dots indicate large orders (whales) and red dots represent smaller, retail-driven transactions. Recent data shows a concentration of large buy orders between $60K and $100K, signaling that institutional and high-net-worth investors remain active despite market consolidation.
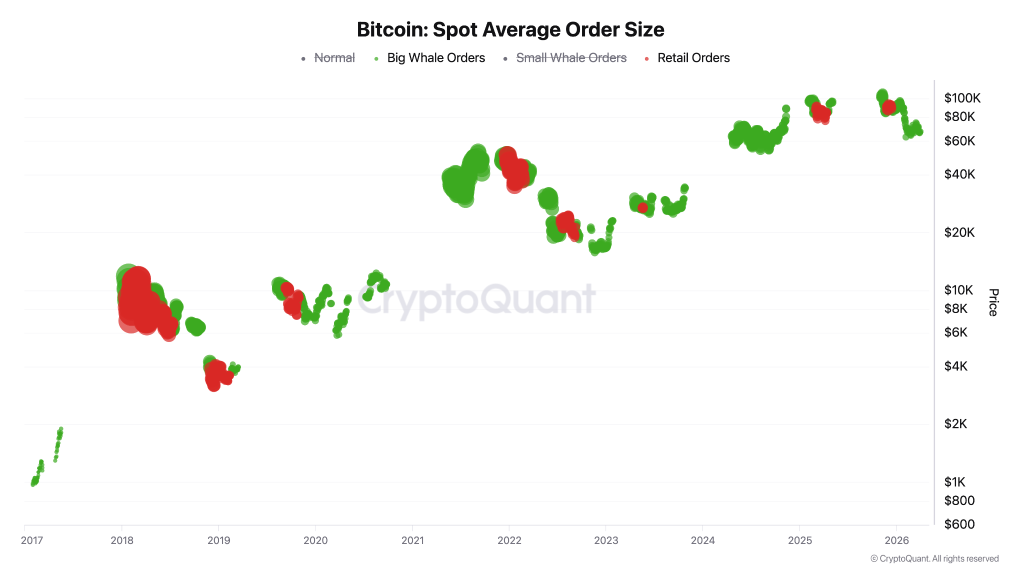
At the same time, retail activity appears limited, with red clusters mainly appearing near short-term price peaks. This suggests a lack of aggressive retail participation, while sustained green clusters suggest ongoing accumulation by whales. Similar patterns in previous cycles have aligned with re-accumulation phases before major moves, hence pointing towards building market positions rather than exiting.
Bitcoin Buyers Lose Control Near Key Levels
Bitcoin’s 90-day Futures Taker CVD (Cumulative Volume Delta) highlights a shift in market behavior, showing that sell-side pressure is increasing while aggressive buying is fading. The chart shows a noticeable rise in red bars, indicating that taker sell orders are dominating the market. At the same time, green bars (buy-side aggression) are becoming less consistent.
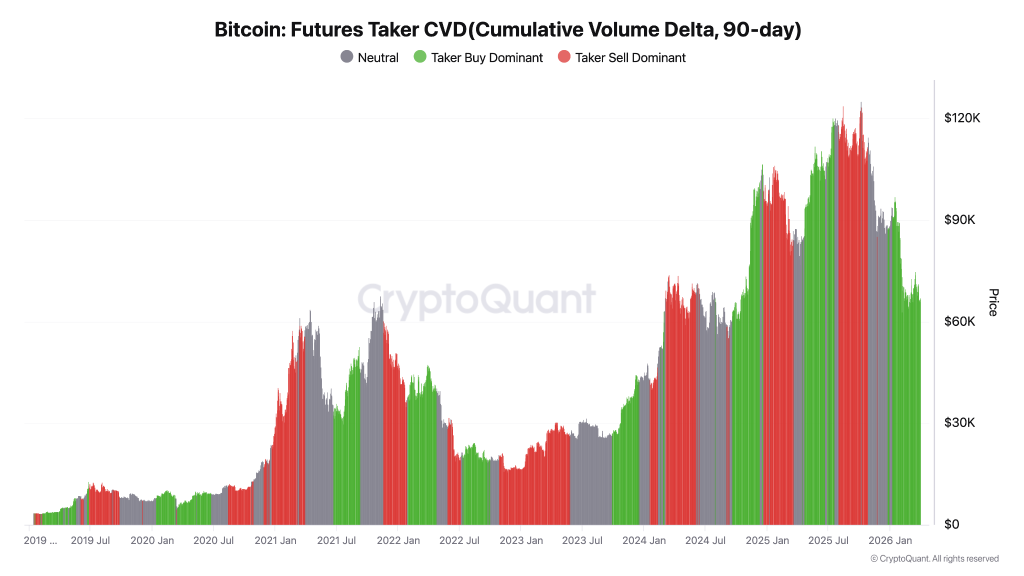
This suggests that traders are increasingly hitting market sells rather than chasing price upward. Even as Bitcoin holds above key support levels, the declining CVD trend signals reduced buy-side conviction, lack of aggressive trend continuation and growing probability of short-term exhaustion. This divergence often appears during consolidation or early distribution phases.
Bitcoin Price Structure Signals a Breakout Setup
Bitcoin is trading near $67,400, continuing to hold above the key $65,600 support level while moving within a rising channel on the daily chart. After a sharp correction, the price has shifted into a tight consolidation range, forming higher lows but failing to break above the $70K–$71K resistance zone. This structure suggests compression, not trend confirmation.
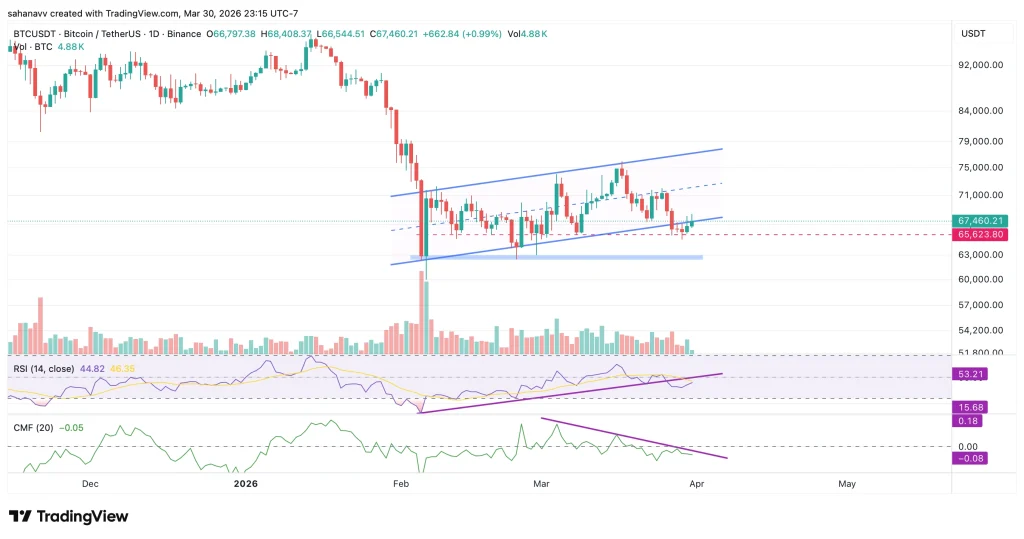
Bitcoin recently bounced from the lower trendline support, confirming that buyers are still defending the structure. However, repeated rejections near $70K highlight strong supply overhead, due to which the price remains range-bound. RSI is gradually trending higher and sits near neutral levels, indicating slow momentum recovery. At the same time, CMF remains negative, showing that capital inflows are still lacking.
This suggests the momentum is stabilizing, but the buyers are not aggressive, also backed by a decline in volume, hinting at reduced participation.
Key Levels to Watch
Immediate support: $65,600Critical support: $63,000–$64,000Breakdown level: $65,000Immediate resistance: $70,000Breakout confirmation: $71,000Upside target: $75,000Above $71K → bullish continuation likelyBelow $65K → downside pressure increases
Will BTC Price Break Past $70,000?
Bitcoin continues to trade within a tight range, holding above the $65,600 support while struggling to reclaim the $70,000 resistance zone. The broader structure remains constructive, with higher lows intact, but momentum indicators and derivatives data show limited buying conviction.
On-chain activity suggests accumulation, yet futures positioning reflects weakening aggressive demand. This mismatch keeps Bitcoin in a consolidation phase rather than a confirmed breakout trend.
A move toward $70,000 remains likely if support holds, but the absence of strong volume and buyer dominance suggests the level may be tested gradually rather than broken decisively. In the near term, Bitcoin is expected to remain range-bound, with a potential push toward $70,000 over the coming days, while a confirmed breakout above $71,000 will be needed to validate sustained upside.
Trust with CoinPedia:
CoinPedia has been delivering accurate and timely cryptocurrency and blockchain updates since 2017. All content is created by our expert panel of analysts and journalists, following strict Editorial Guidelines based on E-E-A-T (Experience, Expertise, Authoritativeness, Trustworthiness). Every article is fact-checked against reputable sources to ensure accuracy, transparency, and reliability. Our review policy guarantees unbiased evaluations when recommending exchanges, platforms, or tools. We strive to provide timely updates about everything crypto & blockchain, right from startups to industry majors.
Investment Disclaimer:
All opinions and insights shared represent the author’s own views on current market conditions. Please do your own research before making investment decisions. Neither the writer nor the publication assumes responsibility for your financial choices.
Sponsored and Advertisements:
Sponsored content and affiliate links may appear on our site. Advertisements are marked clearly, and our editorial content remains entirely independent from our ad partners.
