

Zen Theory
Mar 31, 2026 03:10
Previous installments laid out the theoretical framework of the moving average (MA) trading system. This article applies that framework to an actual stock — Kweichow Moutai (600519), one of China’s most iconic A-share listings — to demonstrate how buy and sell signals are identified across weekly and daily timeframes. Readers are advised to pull up Moutai’s weekly and daily charts from its listing date onward and follow along.
Previous installments laid out the theoretical framework of the moving average (MA) trading system. This article applies that framework to an actual stock — Kweichow Moutai (600519), one of China’s most iconic A-share listings — to demonstrate how buy and sell signals are identified across weekly and daily timeframes. Readers are advised to pull up Moutai’s weekly and daily charts from its listing date onward and follow along.
I. Key Concepts in Review
The interaction between a short-term and a long-term moving average can take three basic forms:
Slight approach (glancing contact): The short-term MA briefly flattens before resuming its prior trend, with no meaningful contact with the long-term MA.
Close approach (near-touch): The short-term MA draws close to the long-term MA without crossing it, then continues in its original direction.
Crossover entanglement (intertwining): The short-term MA crosses through the long-term MA, potentially weaving back and forth in a prolonged entanglement.
Two MA alignment states are also essential:
From these, two primary buy signals are defined:
Type 1 buy signal: Occurs at the end of a bearish alignment, when the final MA entanglement is followed by a divergence-driven decline — i.e., price makes a new low while momentum (as measured by MACD) does not confirm it.
Type 2 buy signal: Occurs after the transition to bullish alignment, when the first MA entanglement triggers a pullback that creates a re-entry opportunity.
II. Weekly Chart Analysis: The 5-Week / 10-Week MA System
Examining Moutai’s weekly chart over nearly six years through the lens of the 5-week and 10-week MA system, only one Type 1 buy signal and one Type 2 buy signal appear across the entire period. This underscores a key characteristic of weekly-level MA systems: valid buy signals are rare, and when they do emerge, they carry significant strategic weight.
The bearish alignment phase (April 2002 – September 2003):
In the week of April 19, 2002, Moutai’s weekly chart shifted into bearish alignment. What followed was a sequence of three MA entanglements:
First entanglement: Week of July 9, 2002. Per the system’s rules, the first entanglement after a bearish alignment shift rarely produces a valid buy signal. At least a second entanglement must occur before conditions are ripe.
Second entanglement: Week of February 14, 2003 — a textbook crossover entanglement. However, the subsequent decline showed no divergence, so the Type 1 buy signal criteria were not met.
Third entanglement: Week of June 27, 2003 — a milder crossover entanglement. This time, the ensuing decline exhibited clear divergence: on the MACD, the green histogram bars were noticeably shorter than those of the prior decline, while the price itself dropped to a lower level than during that prior decline.
The simplest way to confirm when a divergent decline has reached its end: the green MACD bars are shrinking while price continues to make new lows. This occurred definitively in the week of September 26, 2003, marking the formation of the bottom and the completion of the Type 1 buy signal — a high-conviction entry point.
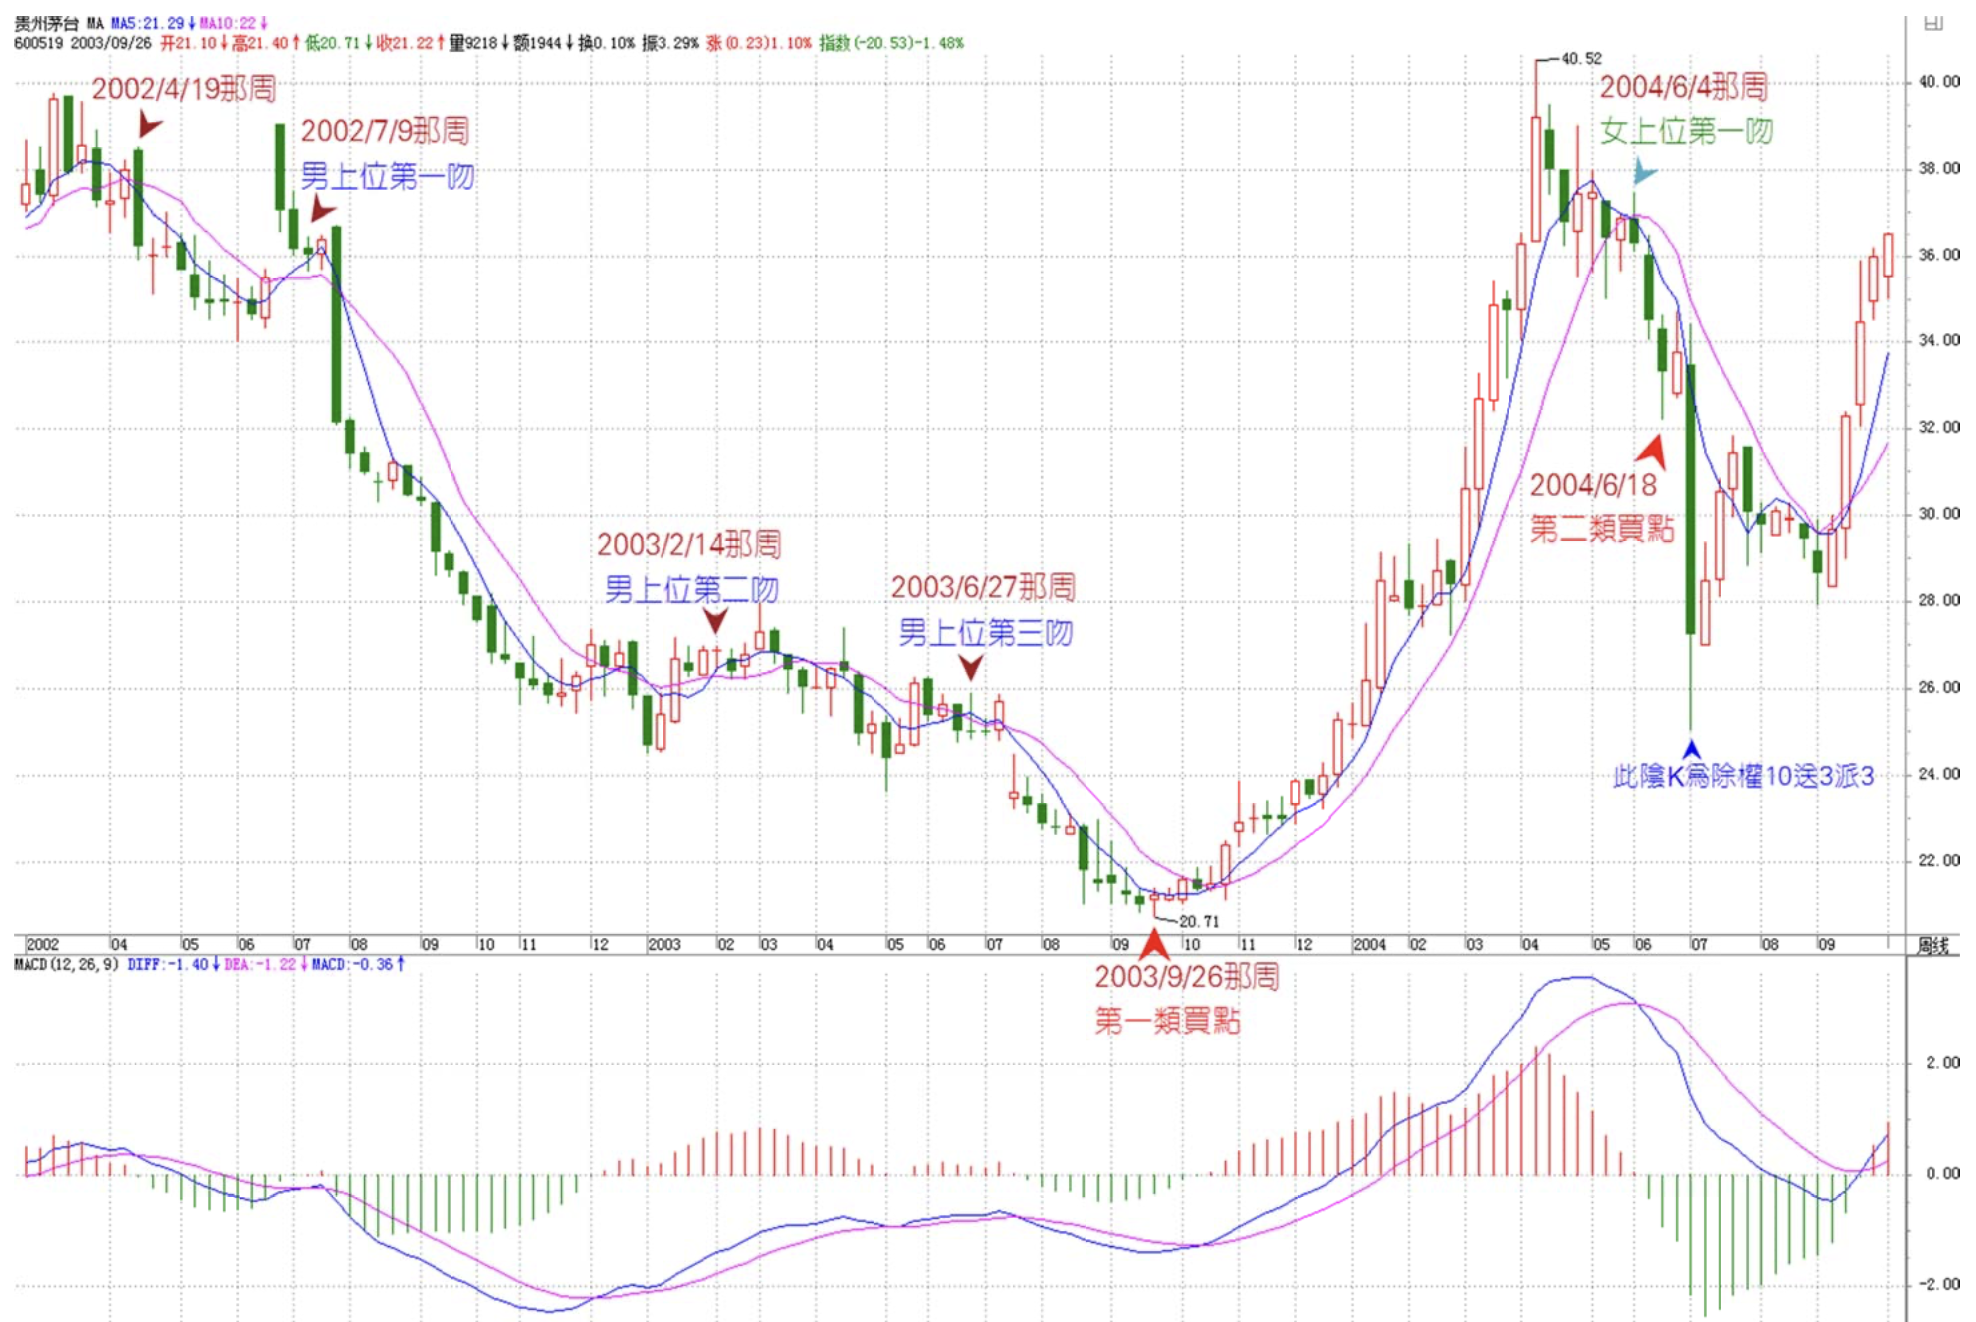
Image description: This is a weekly candlestick chart of Kweichow Moutai (600519) spanning approximately early 2002 to late 2004, with the 5-week MA (blue) and 10-week MA (pink) overlaid. The MACD (12, 26, 9) indicator is shown below. The chart annotates the three MA entanglements during the bearish alignment phase (July 9, 2002; February 14, 2003; June 27, 2003), the Type 1 buy signal formed by the divergent decline after the third entanglement (week of September 26, 2003, at a low of 20.71 yuan), and the first MA entanglement following the shift to bullish alignment (week of June 4, 2004), which corresponds to the Type 2 buy signal.
III. From a Weekly Type 2 Buy Signal to a Daily Type 1 Buy Signal: The Cross-Timeframe Principle
After the Type 1 buy signal was confirmed, Moutai’s weekly chart transitioned into bullish alignment, with the 5-week MA running above the 10-week MA. This persisted until the week of June 4, 2004, when the first MA entanglement in bullish alignment appeared. The pullback that followed constituted the weekly Type 2 buy signal.
A critical operational question arises: How can the Type 2 buy signal be pinpointed with precision?
Because the pullback triggered by the first entanglement in a weekly bullish alignment is typically shallow, it does not generate a fully formed divergent decline on the weekly chart itself. The Type 1 signal’s divergence-based identification method cannot be directly applied at the same timeframe level. The solution is to drop down one timeframe level and look for the corresponding signal on the daily chart.
This yields a fundamental principle:
A Type 2 buy signal on a higher timeframe is constituted by a Type 1 buy signal on the corresponding move in the next lower timeframe.
In other words, a weekly Type 2 buy signal is, in essence, a daily Type 1 buy signal within the relevant daily-level move. Through this principle, all buy signals can ultimately be reduced to Type 1 buy signals at various timeframe levels.
Pinpointing the signal on the daily chart (April–June 2004):
The weekly pullback around June 4, 2004 corresponded to a clear bearish alignment phase on the daily chart. Within that phase, three MA entanglements occurred — on April 29, May 18, and June 1, 2004 — all classic crossover entanglements. The declines following the first two showed no divergence, but after the third, a clear divergence emerged: on June 18, price made a new low while the MACD green histogram bars were markedly shorter than those of the prior decline. This formed the daily-level Type 1 buy signal, which simultaneously served as the weekly-level Type 2 buy signal.
(Note: A subsequent stock dividend adjusted prices downward on the chart, making later prices appear lower than this entry point; on an adjusted basis, the level was not breached.)
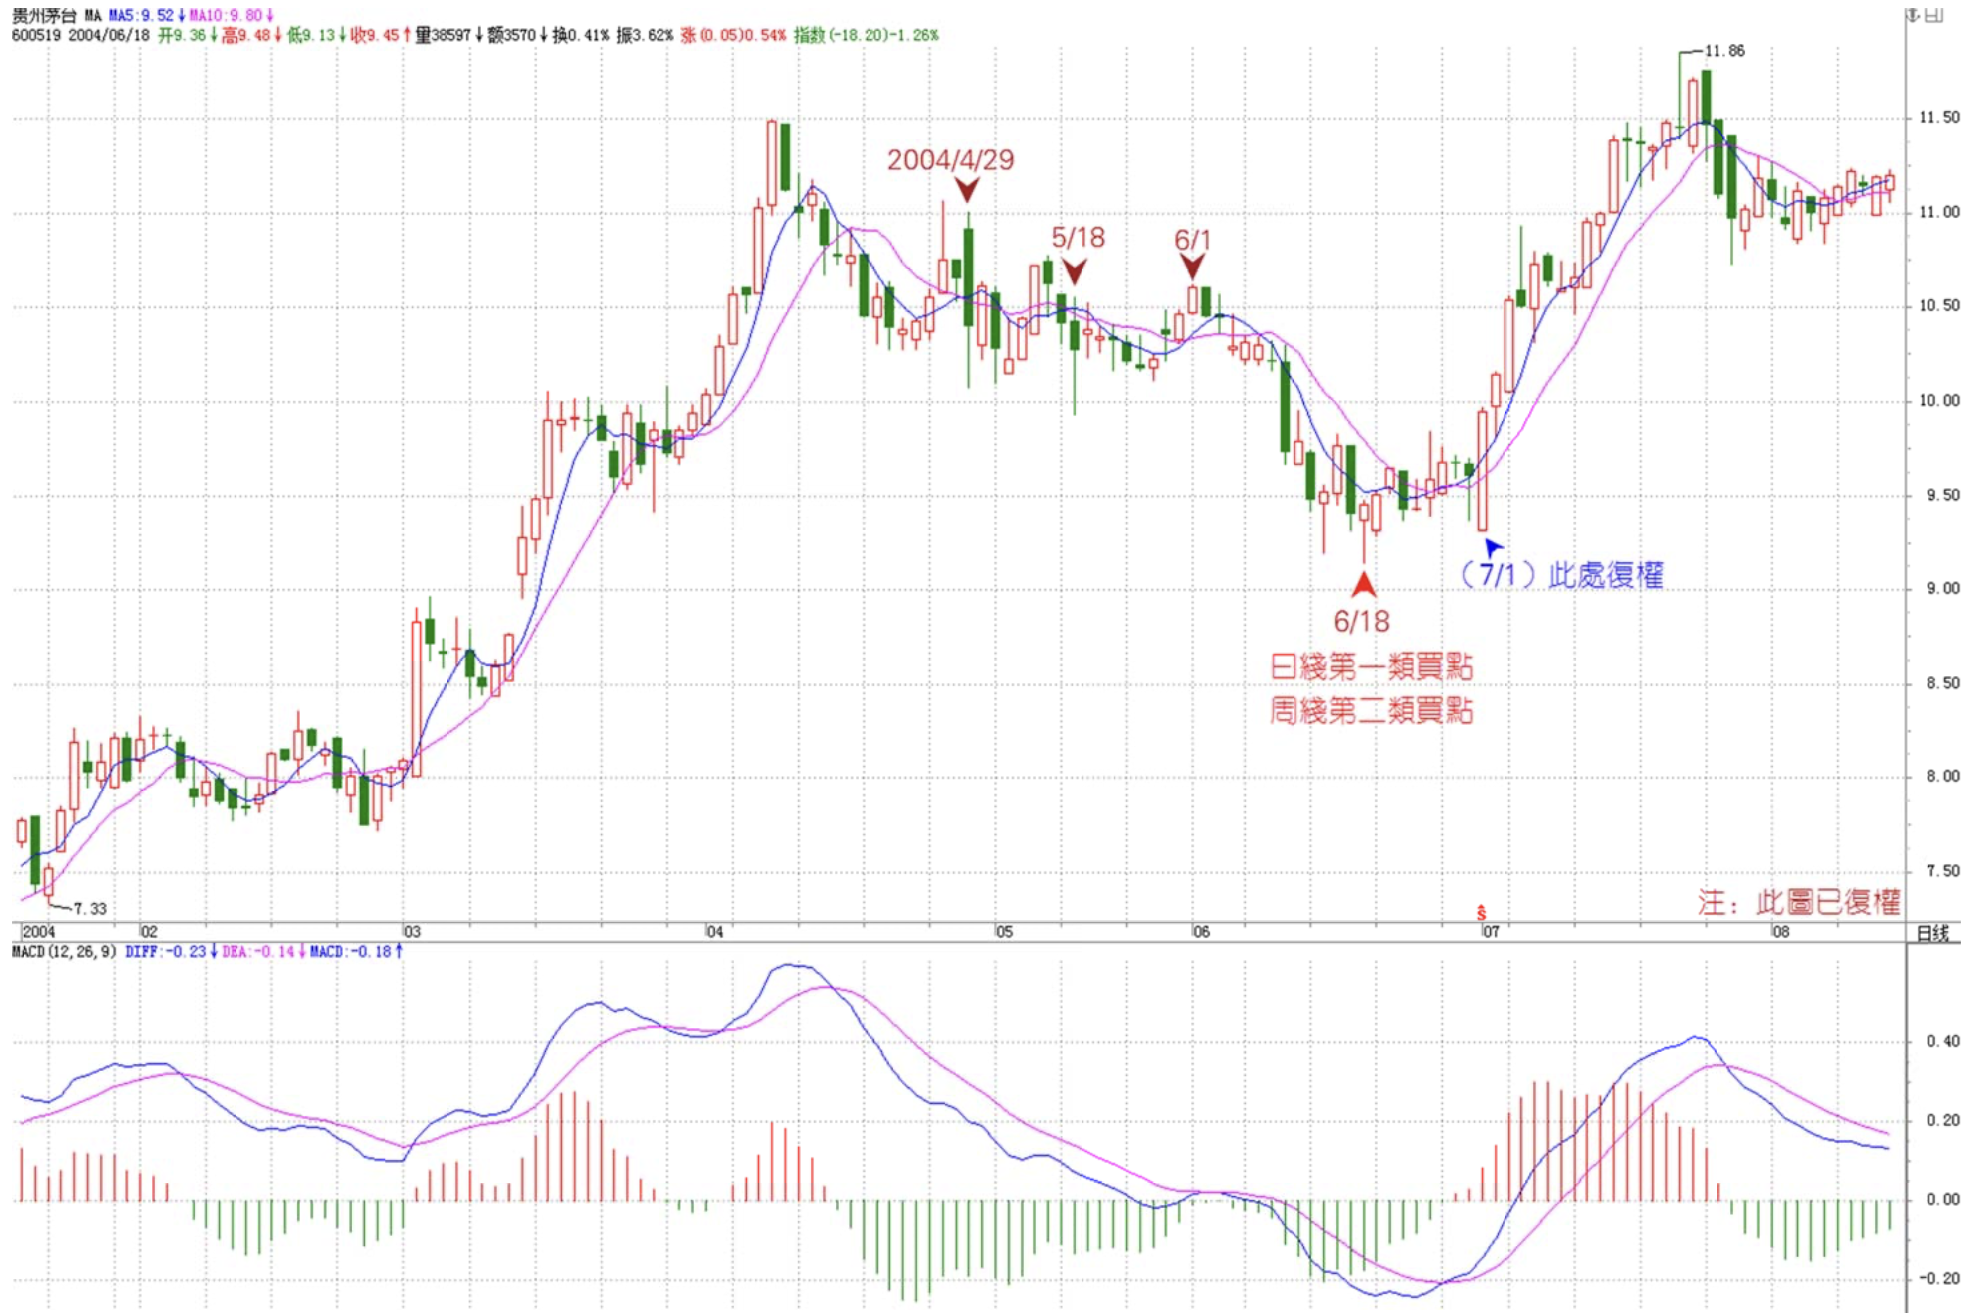
Image description: This is a daily candlestick chart of Kweichow Moutai (adjusted for corporate actions), spanning approximately January to August 2004. It shows the three MA entanglements during the bearish alignment phase (April 29, May 18, June 1, 2004) and the Type 1 buy signal formed on June 18 — which simultaneously represents the weekly Type 2 buy signal. A dividend adjustment is noted at July 1. The MACD indicator below clearly displays the divergence signal after the third entanglement.
IV. Swing Trading on the Daily Level: Trimming at Sub-Level Sell Signals, Re-entering at Sub-Level Buy Signals
From the weekly perspective, Moutai has produced only the two buy signals described above, and as of this writing, no weekly sell signal has appeared. A strict weekly-system operator who entered at either buy point should still be holding the position today.
However, that approach suits only very large capital pools (e.g., above 5 billion yuan). For moderately sized portfolios (e.g., below 1 billion yuan), capital efficiency can be improved by using daily-level signals to sidestep the larger intra-trend corrections — corrections that, from the weekly perspective, do not necessarily warrant action.
The swing-trading procedure is as follows:
After entering on a higher-timeframe buy signal, trim the position when a Type 1 sell signal appears on the next lower timeframe; re-enter when a Type 1 buy signal appears on that same lower timeframe.
For a position initiated on a weekly buy signal, this means using daily Type 1 sell signals to reduce exposure and daily Type 1 buy signals to rebuild it.
Moutai’s daily-level signal sequence:
After entry at the weekly Type 1 buy signal in the week of September 26, 2003, the daily chart shifted into bullish alignment and subsequently produced nine MA entanglements. The first eight entanglements were not followed by divergent rallies. The ninth, occurring around March 26, 2004, was followed by a rally that showed clear divergence: the April 8 high corresponded to MACD red histogram bars that failed to make a new high alongside price. This constituted a daily Type 1 sell signal.
The subsequent alternation of daily buy and sell signals proceeded as follows:
Signal Type
Date
Type 1 sell signal
April 8, 2004
Type 1 buy signal
June 18, 2004
Type 1 sell signal
October 27, 2004
Type 1 buy signal
December 22, 2004
Type 1 sell signal
April 26, 2005
Type 1 buy signal
December 13, 2005
This means that even from the daily-chart perspective, the position entered on the Type 1 buy signal of December 13, 2005 has not produced a single sell signal to date. The only correct course of action remains to hold.
For traders with smaller capital who operate primarily on the daily level, the same logic can be pushed further down to 30-minute or other intraday timeframes, seeking Type 1 sell signals within those sub-levels to capture short-term swings. That level of granularity is beyond the scope of this article.
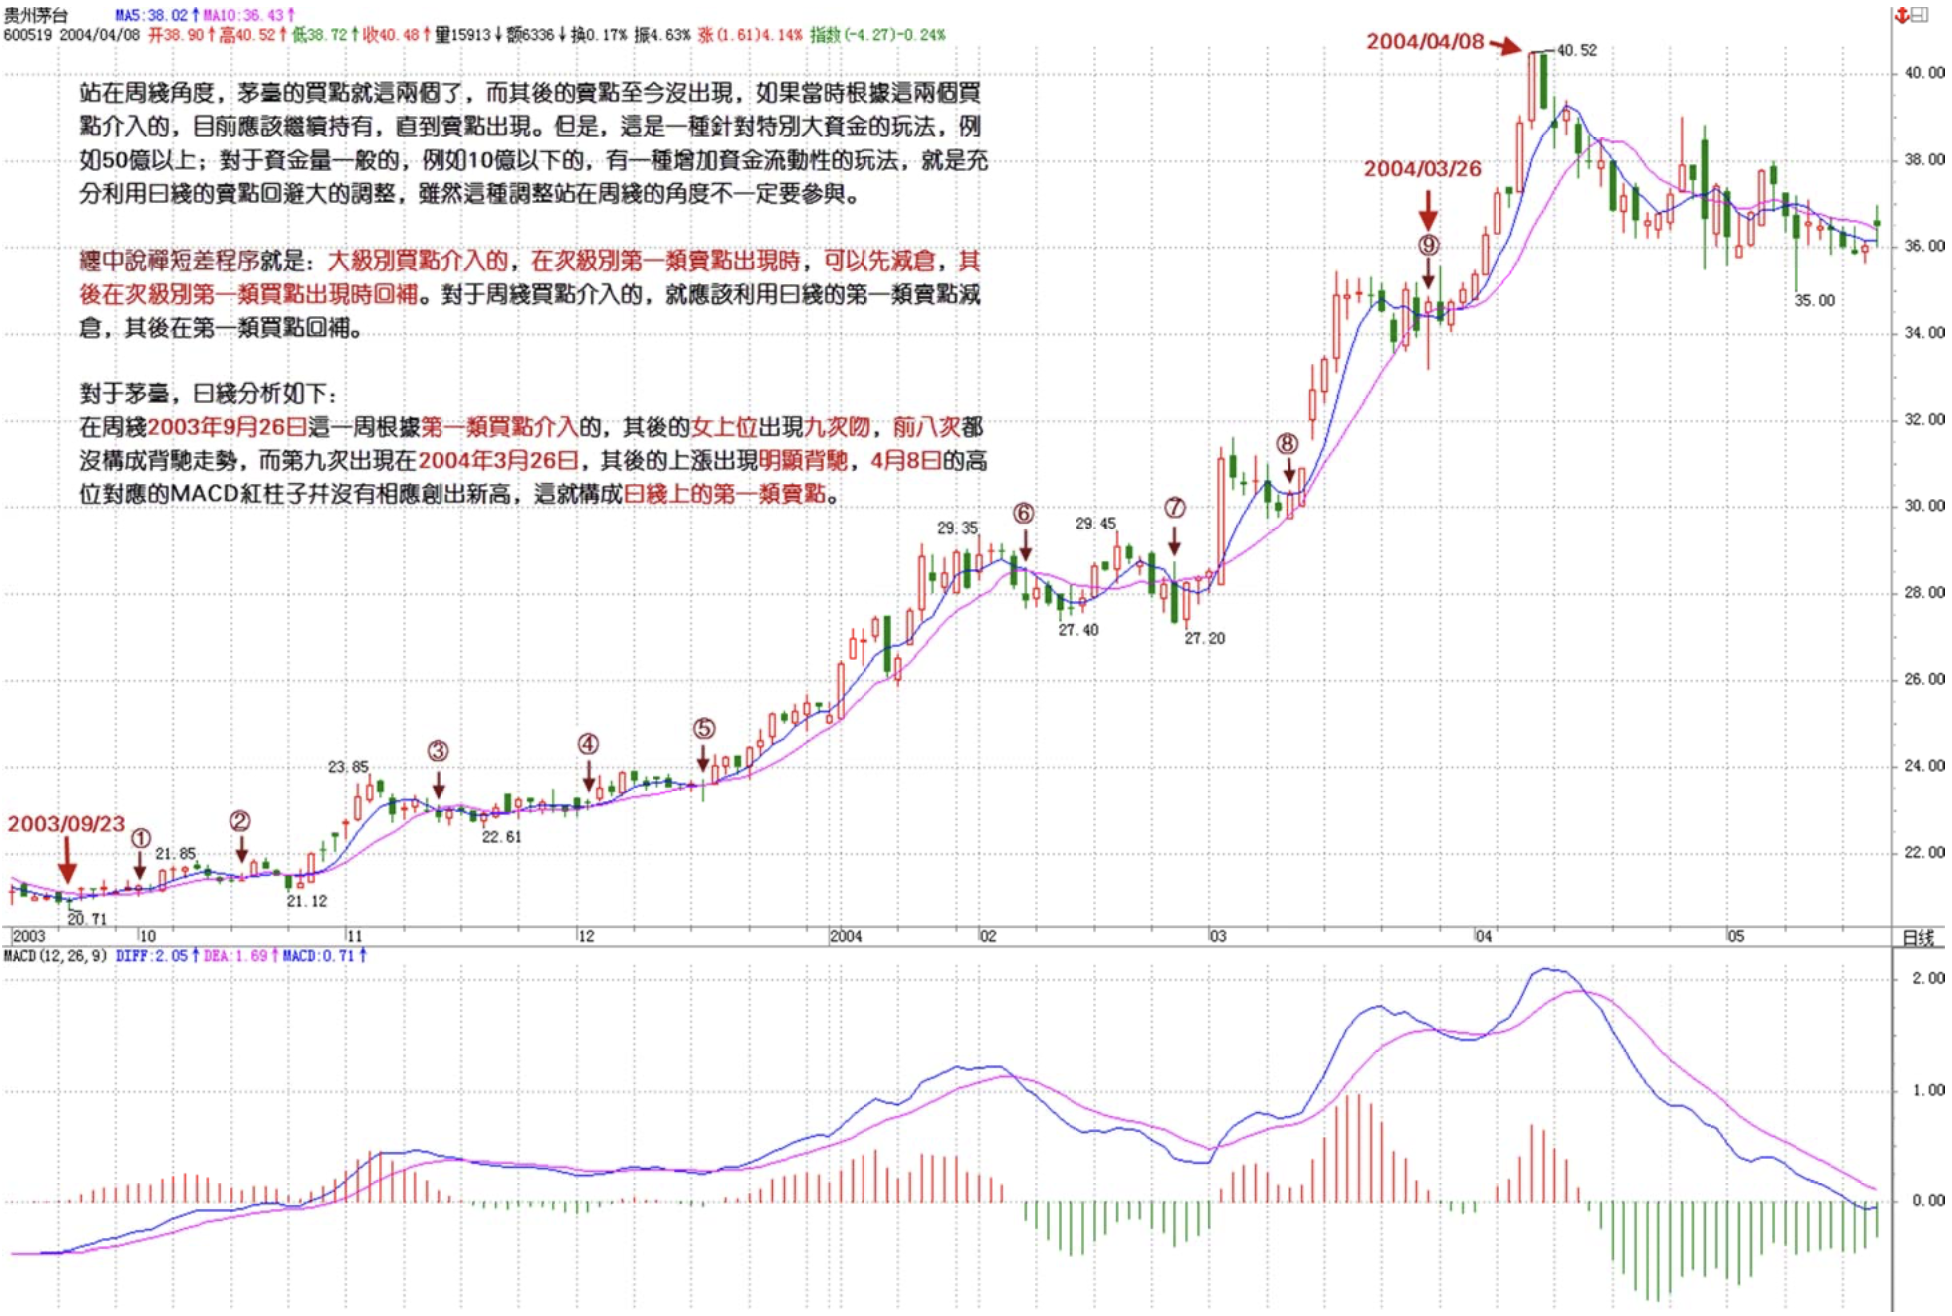
Image description: This is a daily candlestick chart of Kweichow Moutai spanning approximately September 2003 to May 2005. It annotates nine MA entanglements (numbered ① through ⑨) that occurred during the bullish alignment following the September 2003 entry, along with key price levels at each swing point (e.g., 20.71, 21.85, 23.85, 22.61, 29.35, 27.40, 29.45, 27.20). The chart highlights the divergence after the ninth entanglement around March 26, 2004, and the resulting daily Type 1 sell signal at the April 8, 2004 high of 40.52 yuan. The MACD indicator below shows the red histogram bars failing to make a new high in tandem with price — confirming the divergence. Accompanying text explains the cross-timeframe principle and the swing-trading procedure.
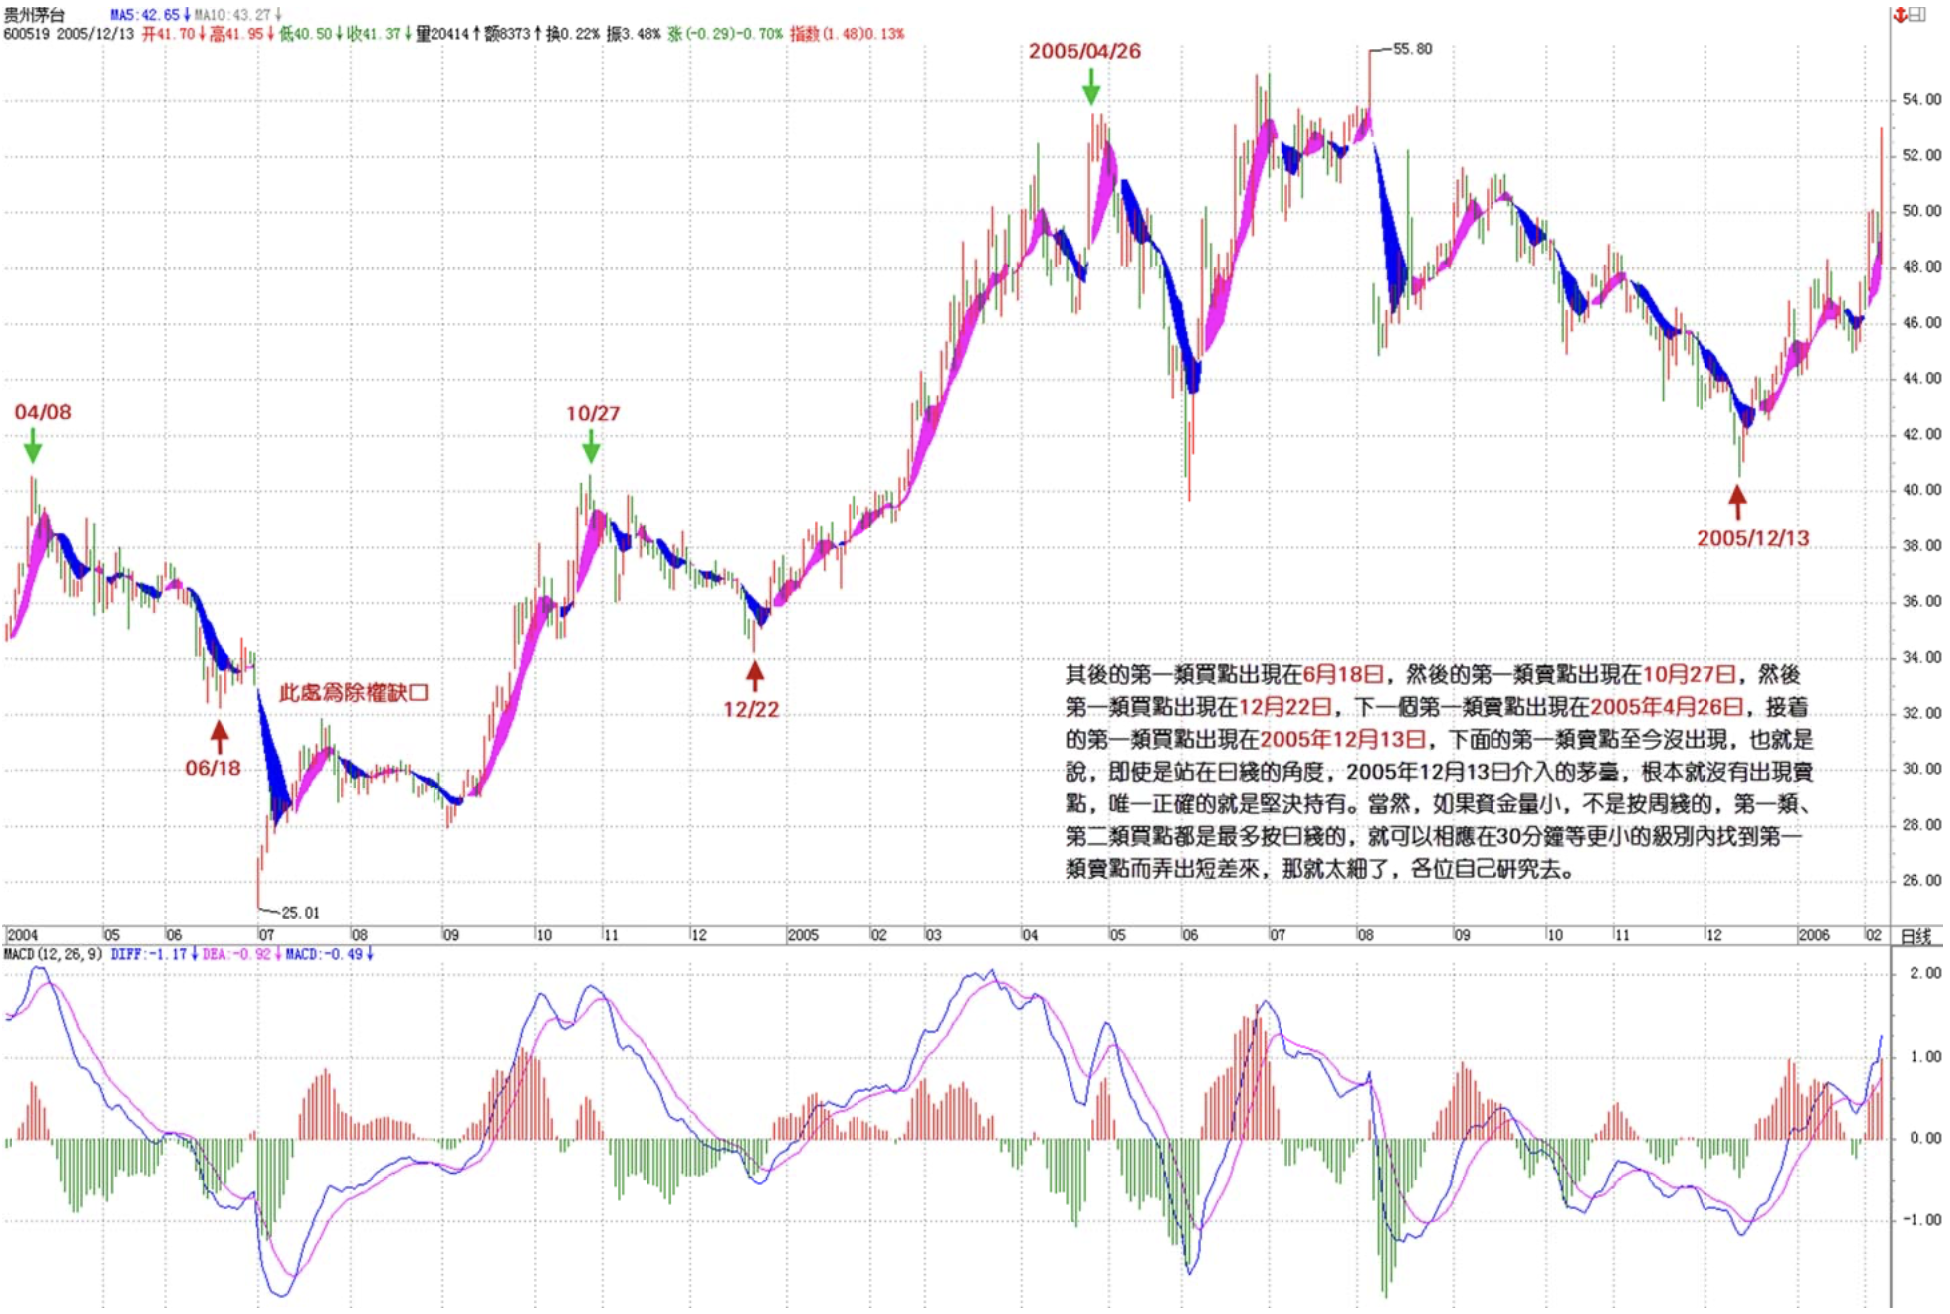
Image description: This is a daily candlestick chart of Kweichow Moutai spanning approximately April 2004 to February 2006. Blue and pink shaded sections alternately highlight bullish and bearish alignment phases. Arrows mark each daily-level Type 1 buy and sell signal: sell on April 8, buy on June 18, sell on October 27, buy on December 22, sell on April 26, 2005, and buy on December 13, 2005. The highest price annotated is 55.80 yuan; the lowest, at a dividend-adjustment gap, is 25.01 yuan. Accompanying text notes that no new daily Type 1 sell signal has appeared since December 13, 2005, affirming the hold recommendation, and suggests that smaller traders may look to 30-minute charts for finer-grained swing opportunities.
V. Summary
Effective use of the MA-based trading system rests on two core principles:
First, the cross-timeframe principle: A Type 2 buy signal on a higher timeframe is constituted by a Type 1 buy signal on the corresponding move in the next lower timeframe. This allows all buy signals to be ultimately reduced to Type 1 buy signals across different timeframe levels, enabling precise entry timing.
Second, the swing-trading procedure: After entering on a higher-timeframe buy signal, use the next lower timeframe’s Type 1 sell signals to trim and its Type 1 buy signals to re-enter, thereby improving capital efficiency without abandoning the higher-timeframe position.
In practice, traders must determine their primary operating timeframe based on their capital size and temperament, then drill these methods through repeated study of actual chart patterns. Theory that never meets the chart remains an abstraction with no operational value.
The Latest Zen Theory:
Active Protection Mechanisms in Buy Programs — Redefining Stop-Loss and Deriving Exit Rules
Operationalization of Moving Average Interaction Classification — Risk Systematization and Optimal Entry-Exit Point Derivation
A Taxonomy of Moving Average Interactions – The Essential Nature and Application of Technical Indicators as Market State Evaluation Systems
Image source: Shutterstock