

XRP price has remained under pressure since the beginning of 2026, extending a steady downtrend that started in early January. The altcoin has repeatedly failed to reclaim major resistance levels.
Weak macro sentiment and geopolitical tensions have limited upside momentum across the broader crypto market. Despite the ongoing decline, several historical and on-chain indicators suggest XRP may be approaching a turning point.
XRP Holders’ Losses Near End
The Net Unrealized Profit and Loss indicator shows XRP remains in capitulation territory. This phase reflects that a majority of holders are sitting on unrealized losses. Capitulation typically marks the late stage of a downtrend rather than the beginning.
Historically, XRP’s capitulation phases have lasted close to one month before reversing. The current stretch began at the start of February. If prior patterns repeat, this period could end for the XRP price in the first week of March. A reduction in panic-driven selling would allow price stabilization and open the door to recovery.
Want more token insights like this? Sign up for Editor Harsh Notariya’s Daily Crypto Newsletter here.
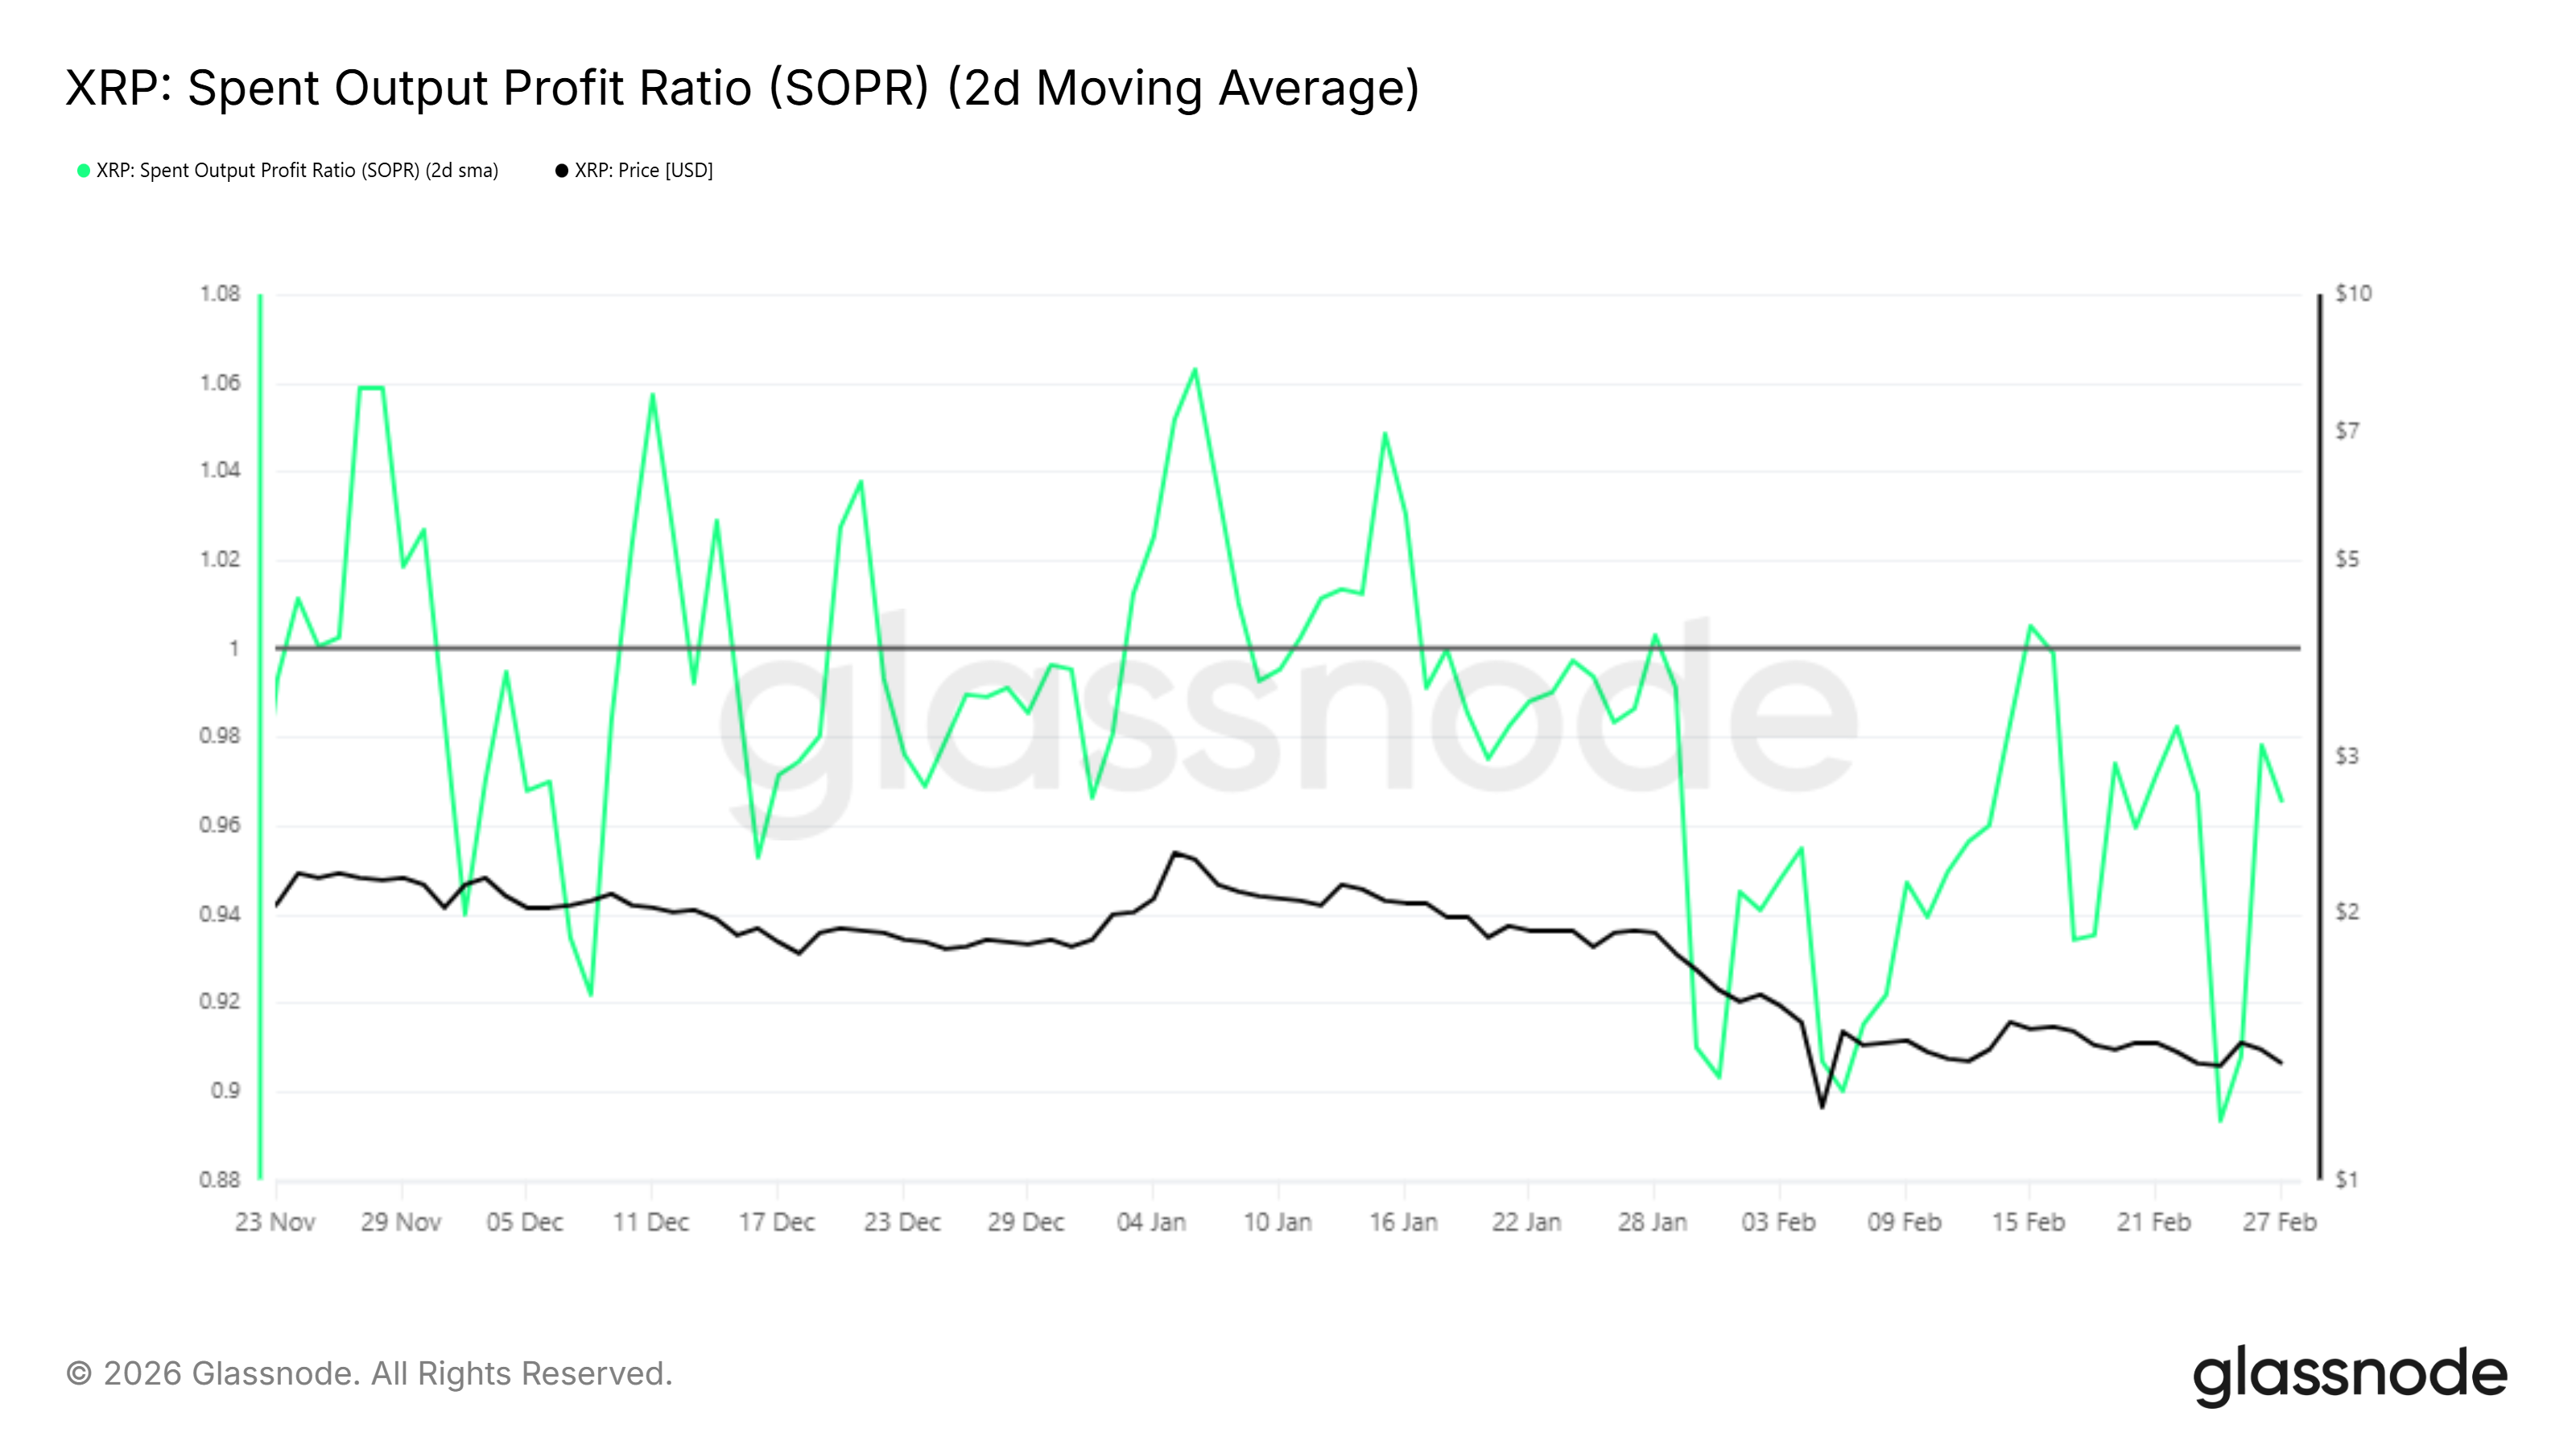
The Spent Output Profit Ratio, or SOPR, confirms that many XRP holders are still selling at a loss. A brief move above 1 occurred in mid-February, signaling temporary profitability. However, the metric quickly fell back below 1, showing renewed selling pressure.
SOPR approaching the 1 level again is significant. A sustained move above this threshold would indicate that coins are being sold at a profit. Historically, this shift often coincides with early recovery phases. If selling continues to saturate, the XRP price may gain room to rebound.
What Does XRP’s Past Say?
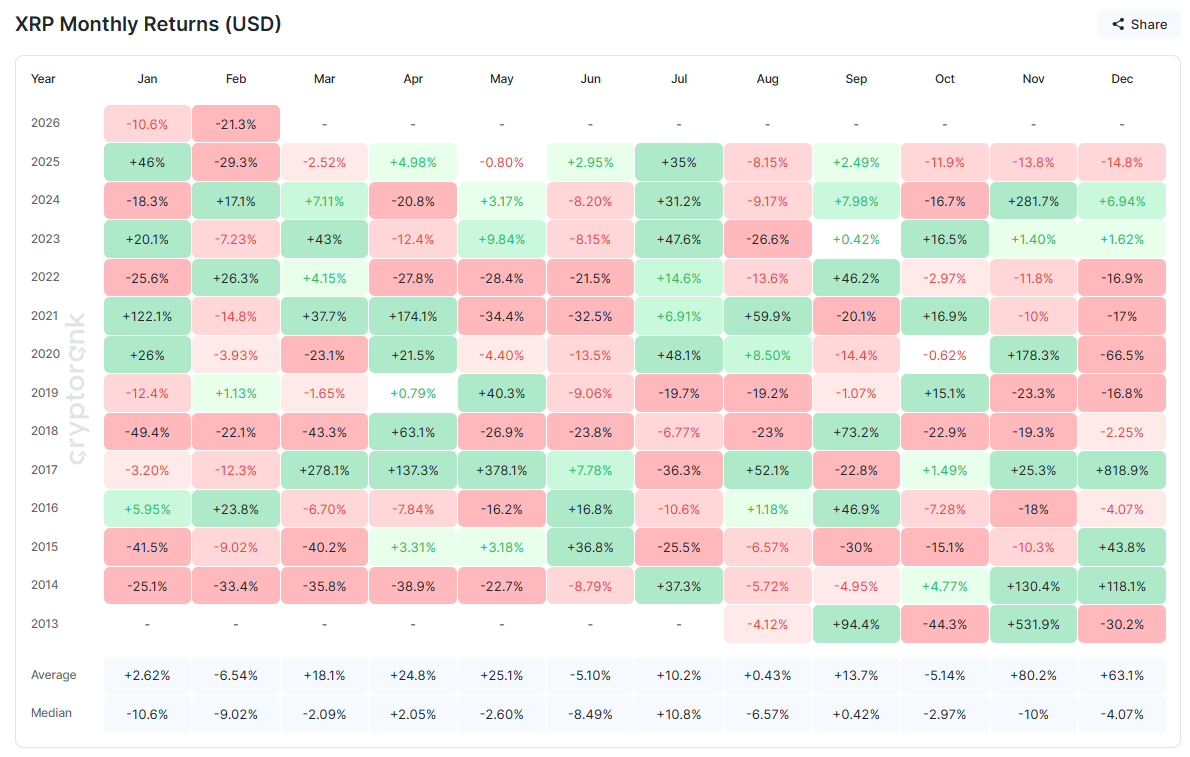
Seasonality data shows that over the past 12 years, March has delivered an average 18% return for XRP. This makes it statistically the strongest month in the first quarter.
While past performance does not guarantee future gains, historical trends matter. However, external risks remain. Escalating geopolitical tensions involving the US and Israel could affect risk appetite. Broader financial instability may delay seasonal bullish tendencies.
XRP Price Levels To Watch
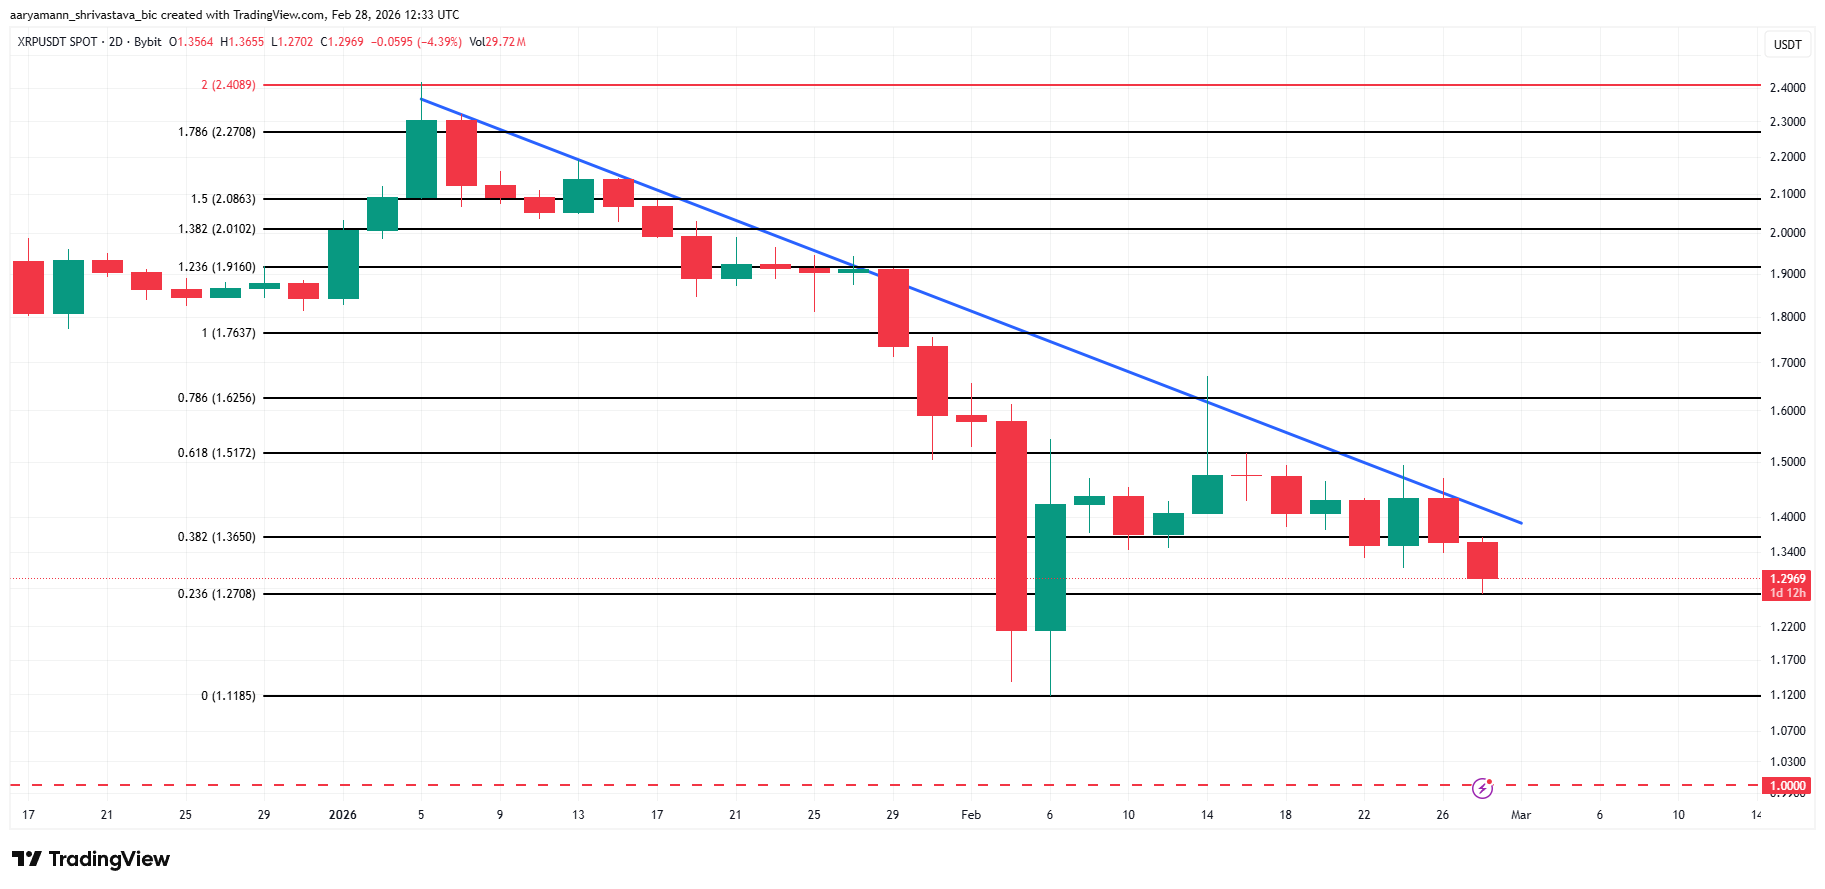
XRP is trading at $1.29 at the time of writing, holding above the critical $1.27 support level. This level aligns with the 23.6% Fibonacci retracement, often referred to as the bear market support floor. Maintaining this threshold is essential to prevent a deeper correction.
If capitulation ends and macro conditions stabilize, XRP could bounce from $1.27 and challenge the descending trendline active since January. A move above $1.51 would confirm a structural shift. This level also coincides with the 61.8% Fibonacci retracement, a key recovery benchmark.
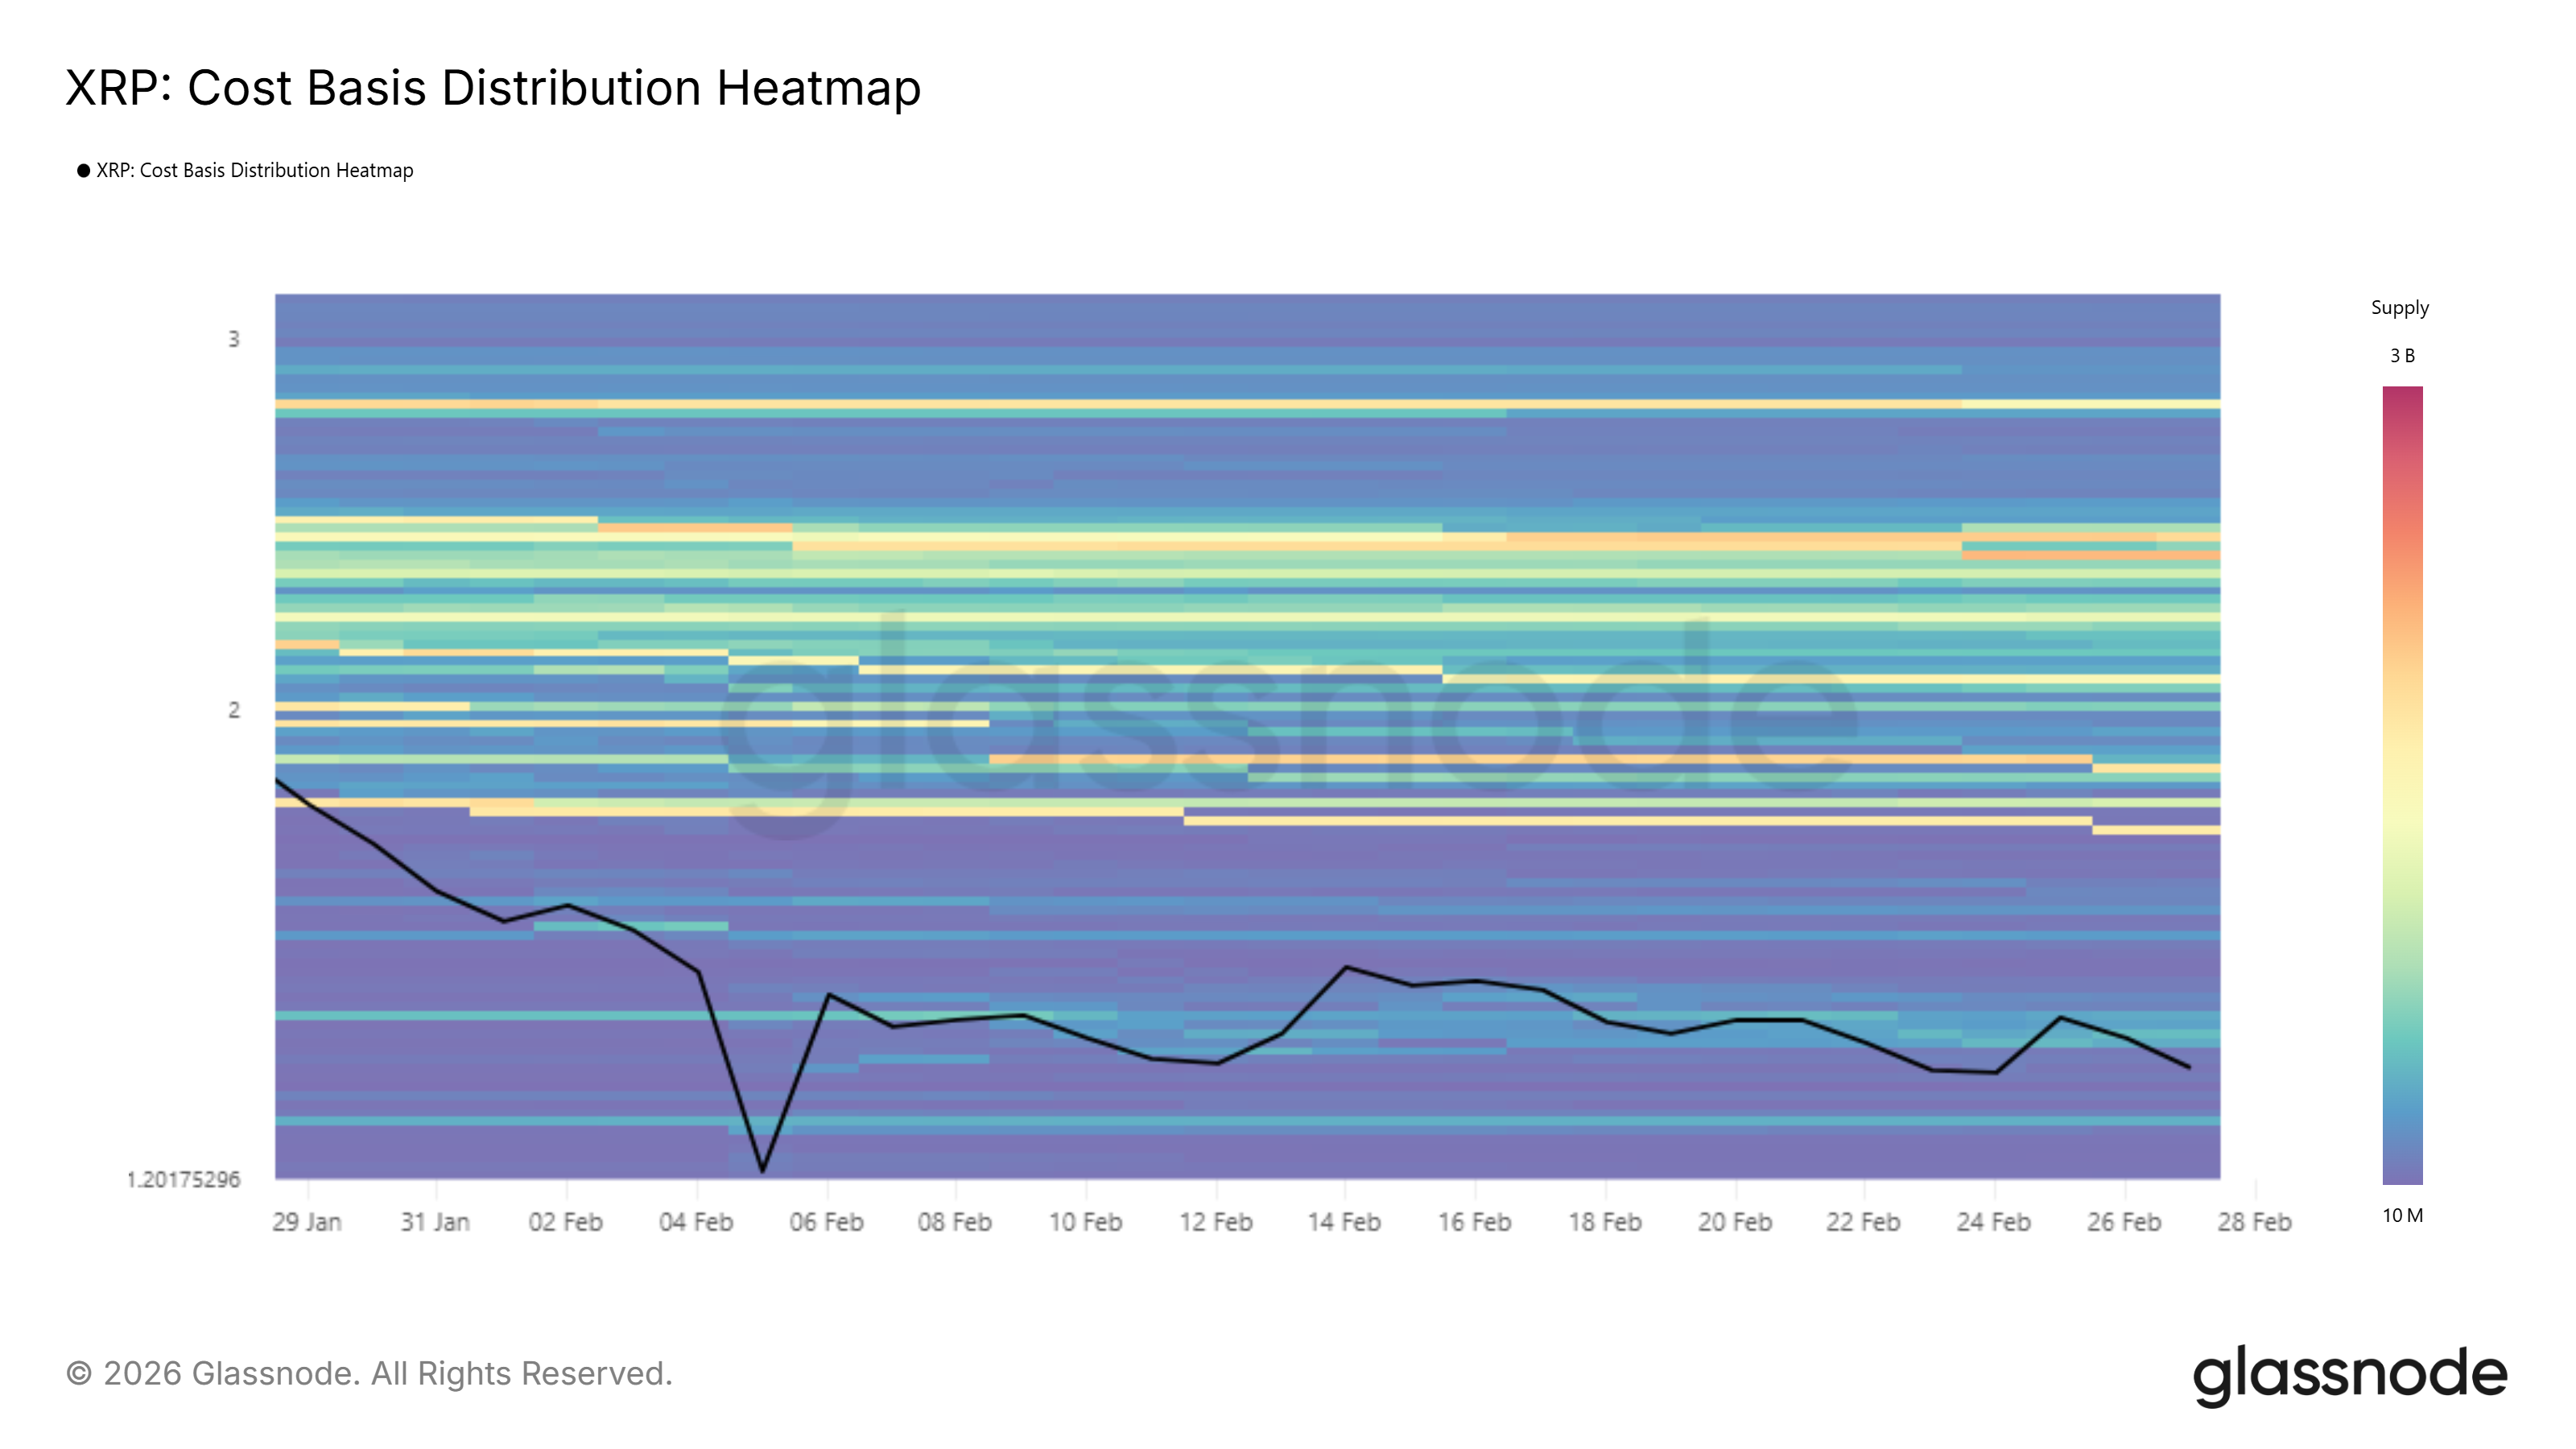
On-chain data suggests limited resistance until the $1.76 to $1.80 range. Approximately 1.85 billion XRP were accumulated within this zone, valued at nearly $2.83 billion. Holders who bought there may sell to break even, creating temporary resistance.
However, failure to hold $1.27 would invalidate the bullish outlook. A breakdown below the bear market support floor could send XRP toward $1.11. Continued sideways consolidation remains possible if global uncertainty persists. For now, March presents both risk and opportunity for XRP price recovery.
