


BNB price has entered a decisive corrective phase, sliding more than 6% and breaking below the psychological $600 level amid a broader crypto market downturn. The move was not random. Price action confirms a bearish flag breakdown on the daily timeframe, signaling that the recent consolidation was a continuation pattern rather than a base-building structure. With market sentiment turning defensive and risk appetite fading across major altcoins, the BNB price now faces mounting selling pressure at a critical juncture.
Bearish Flag Breakdown Shifts BNB Price Lower: Is $500 the Next Stop?
BNB price spent several sessions forming a tight upward-sloping channel following its prior decline, a textbook bearish flag formation. This pattern typically signals a temporary relief bounce before another leg lower, and the recent selloff validates that structure. The breakdown occurred near the $620 rejection zone, where sellers repeatedly capped upside attempts. Once the BNB price lost the $600 support level, selling pressure deepened, confirming that buyers were unable to absorb supply at key resistance.
The momentum indicators are also titling bearish, with RSI and MACD showcasing bearish crossover. The breakdown with heightened volume adds credibility to the move, indicating bearish conviction rather than a low-liquidity drift lower.
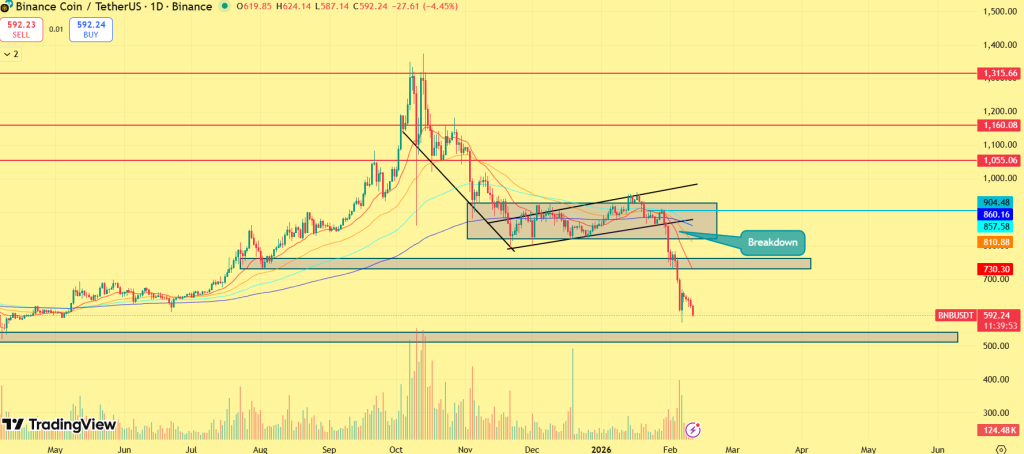
With BNB price now trading below $600, this former support turns into immediate resistance. Any short-term bounce toward $600–$610 is likely to face renewed selling pressure unless broader market conditions improve.
On the downside, the first technical checkpoint sits near $560, a minor intraday reaction level. However, the more significant demand band lies between $520 and $500, where historical buying interest previously emerged. A clean break below $500 would alter the broader medium-term structure and could expose deeper retracement levels, though for now, the market is focusing on whether bulls can defend the mid-$500 region.
Also Read : What Are Ethereum Whales Up To as ETH Trades Below Their Cost Basis: Accumulating or Distributing? ,
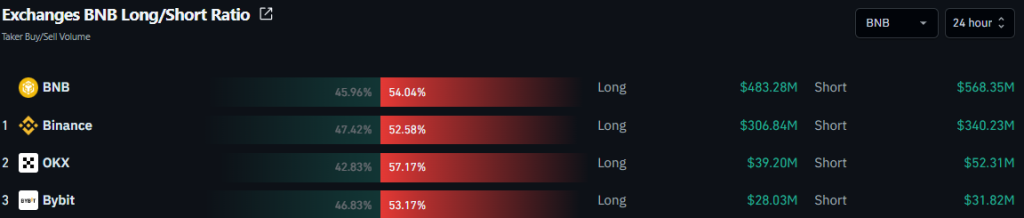
Top Exchange Positioning Shows Shorts in Control
Derivative data positioning adds weight to the bearish continuation narrative across the major exchanges over the past 24 hours. On Binance, short exposure stands near $584 million compared to roughly $492 million in long positions, indicating that sellers currently maintain control of directional leverage On OKX, where approximately $351 million in shorts outweighs nearly $315 million in long contracts, reinforcing the broader tilt toward downside expectations among active derivatives traders. Bybit also reflects this imbalance, with short positions around $53 million exceeding long exposure near $40 million, suggesting that speculative positioning remains skewed in favor of further correction rather than immediate recovery.
This consistent dominance of short exposure across the top three exchanges signals that market participants are not yet positioning aggressively for a rebound. Instead, traders appear to be leaning into continuation risk, particularly after the confirmed bearish flag breakdown below the $600 threshold. Moreover, Liquidation data further supports this view. As BNB slipped under key support, leveraged longs were flushed out, accelerating downside momentum. Meanwhile, cumulative short liquidity now clusters above the $610–$620 region, meaning any sharp recovery into that zone could trigger forced buying. Until that level is reclaimed decisively, however, derivatives positioning continues to favor sellers.
Can $500 Become the Next Magnet?
BNB price remains structurally vulnerable below $600. The confirmed bearish flag breakdown shifts technical focus toward the $520–$500 region as the next meaningful support cluster. A relief bounce toward $600–$610 is possible, especially if broader market conditions stabilize. However, without a sustained reclaim of $610 accompanied by rising volume and improving long/short ratios, upside moves are likely to be treated as corrective. If sellers maintain control and derivatives positioning continues to favor shorts, the $500 zone could act as the next magnet for liquidity before any durable reversal attempt develops.
FAQs
BNB is trending lower after breaking $600, with $520–$500 as the next likely support zone.
A short-term bounce to $600–$610 is possible, but strong selling pressure may limit any sustainable rebound.
Negative crypto sentiment and heavy short positions favor further BNB decline, making lower levels like $500 more likely.
Trust with CoinPedia:
CoinPedia has been delivering accurate and timely cryptocurrency and blockchain updates since 2017. All content is created by our expert panel of analysts and journalists, following strict Editorial Guidelines based on E-E-A-T (Experience, Expertise, Authoritativeness, Trustworthiness). Every article is fact-checked against reputable sources to ensure accuracy, transparency, and reliability. Our review policy guarantees unbiased evaluations when recommending exchanges, platforms, or tools. We strive to provide timely updates about everything crypto & blockchain, right from startups to industry majors.
Investment Disclaimer:
All opinions and insights shared represent the author’s own views on current market conditions. Please do your own research before making investment decisions. Neither the writer nor the publication assumes responsibility for your financial choices.
Sponsored and Advertisements:
Sponsored content and affiliate links may appear on our site. Advertisements are marked clearly, and our editorial content remains entirely independent from our ad partners.