


MSTR price has fallen nearly 22% over the past month, closely tracking Bitcoin’s roughly 23% decline over the same period. As Bitcoin’s weakness deepens, pressure is also building on MicroStrategy’s massive BTC treasury. Recent estimates show more than $3.5 billion in unrealized, or “paper,” losses on its Bitcoin holdings.
That drawdown has pushed some Wall Street firms to slash price targets, including a sharp 60% cut from one major analyst. Still, technical charts and capital flow data suggest MicroStrategy’s long-term rebound case is not fully broken. Here is what the charts are really showing.
Bullish Wedge and Rising CMF Show Big Money Is Still Buying
Despite recent losses, MicroStrategy’s daily chart continues to trade inside a falling wedge pattern. It often signals that selling pressure is weakening and that a rebound may follow once resistance breaks. Plus, the upper trendline is close and currently aligns with the 20-day exponential moving average.
Sponsored
Sponsored
Historically, this pattern has worked well for MSTR. In early October and again in mid-January, the stock rallied 10% to 15% after reclaiming its 20-day exponential moving average, or EMA. The EMA is a trend line that reacts quickly to price changes.
As mentioned, that same 20-day EMA sits close to the upper wedge boundary. This means any breakout could happen quickly if buying strength returns.
Another key signal comes from the Chaikin Money Flow, or CMF. CMF measures whether large investors are putting money into or taking money out of an asset using price and volume data. Since January 12, CMF has been trending higher, even while the stock price has moved lower.
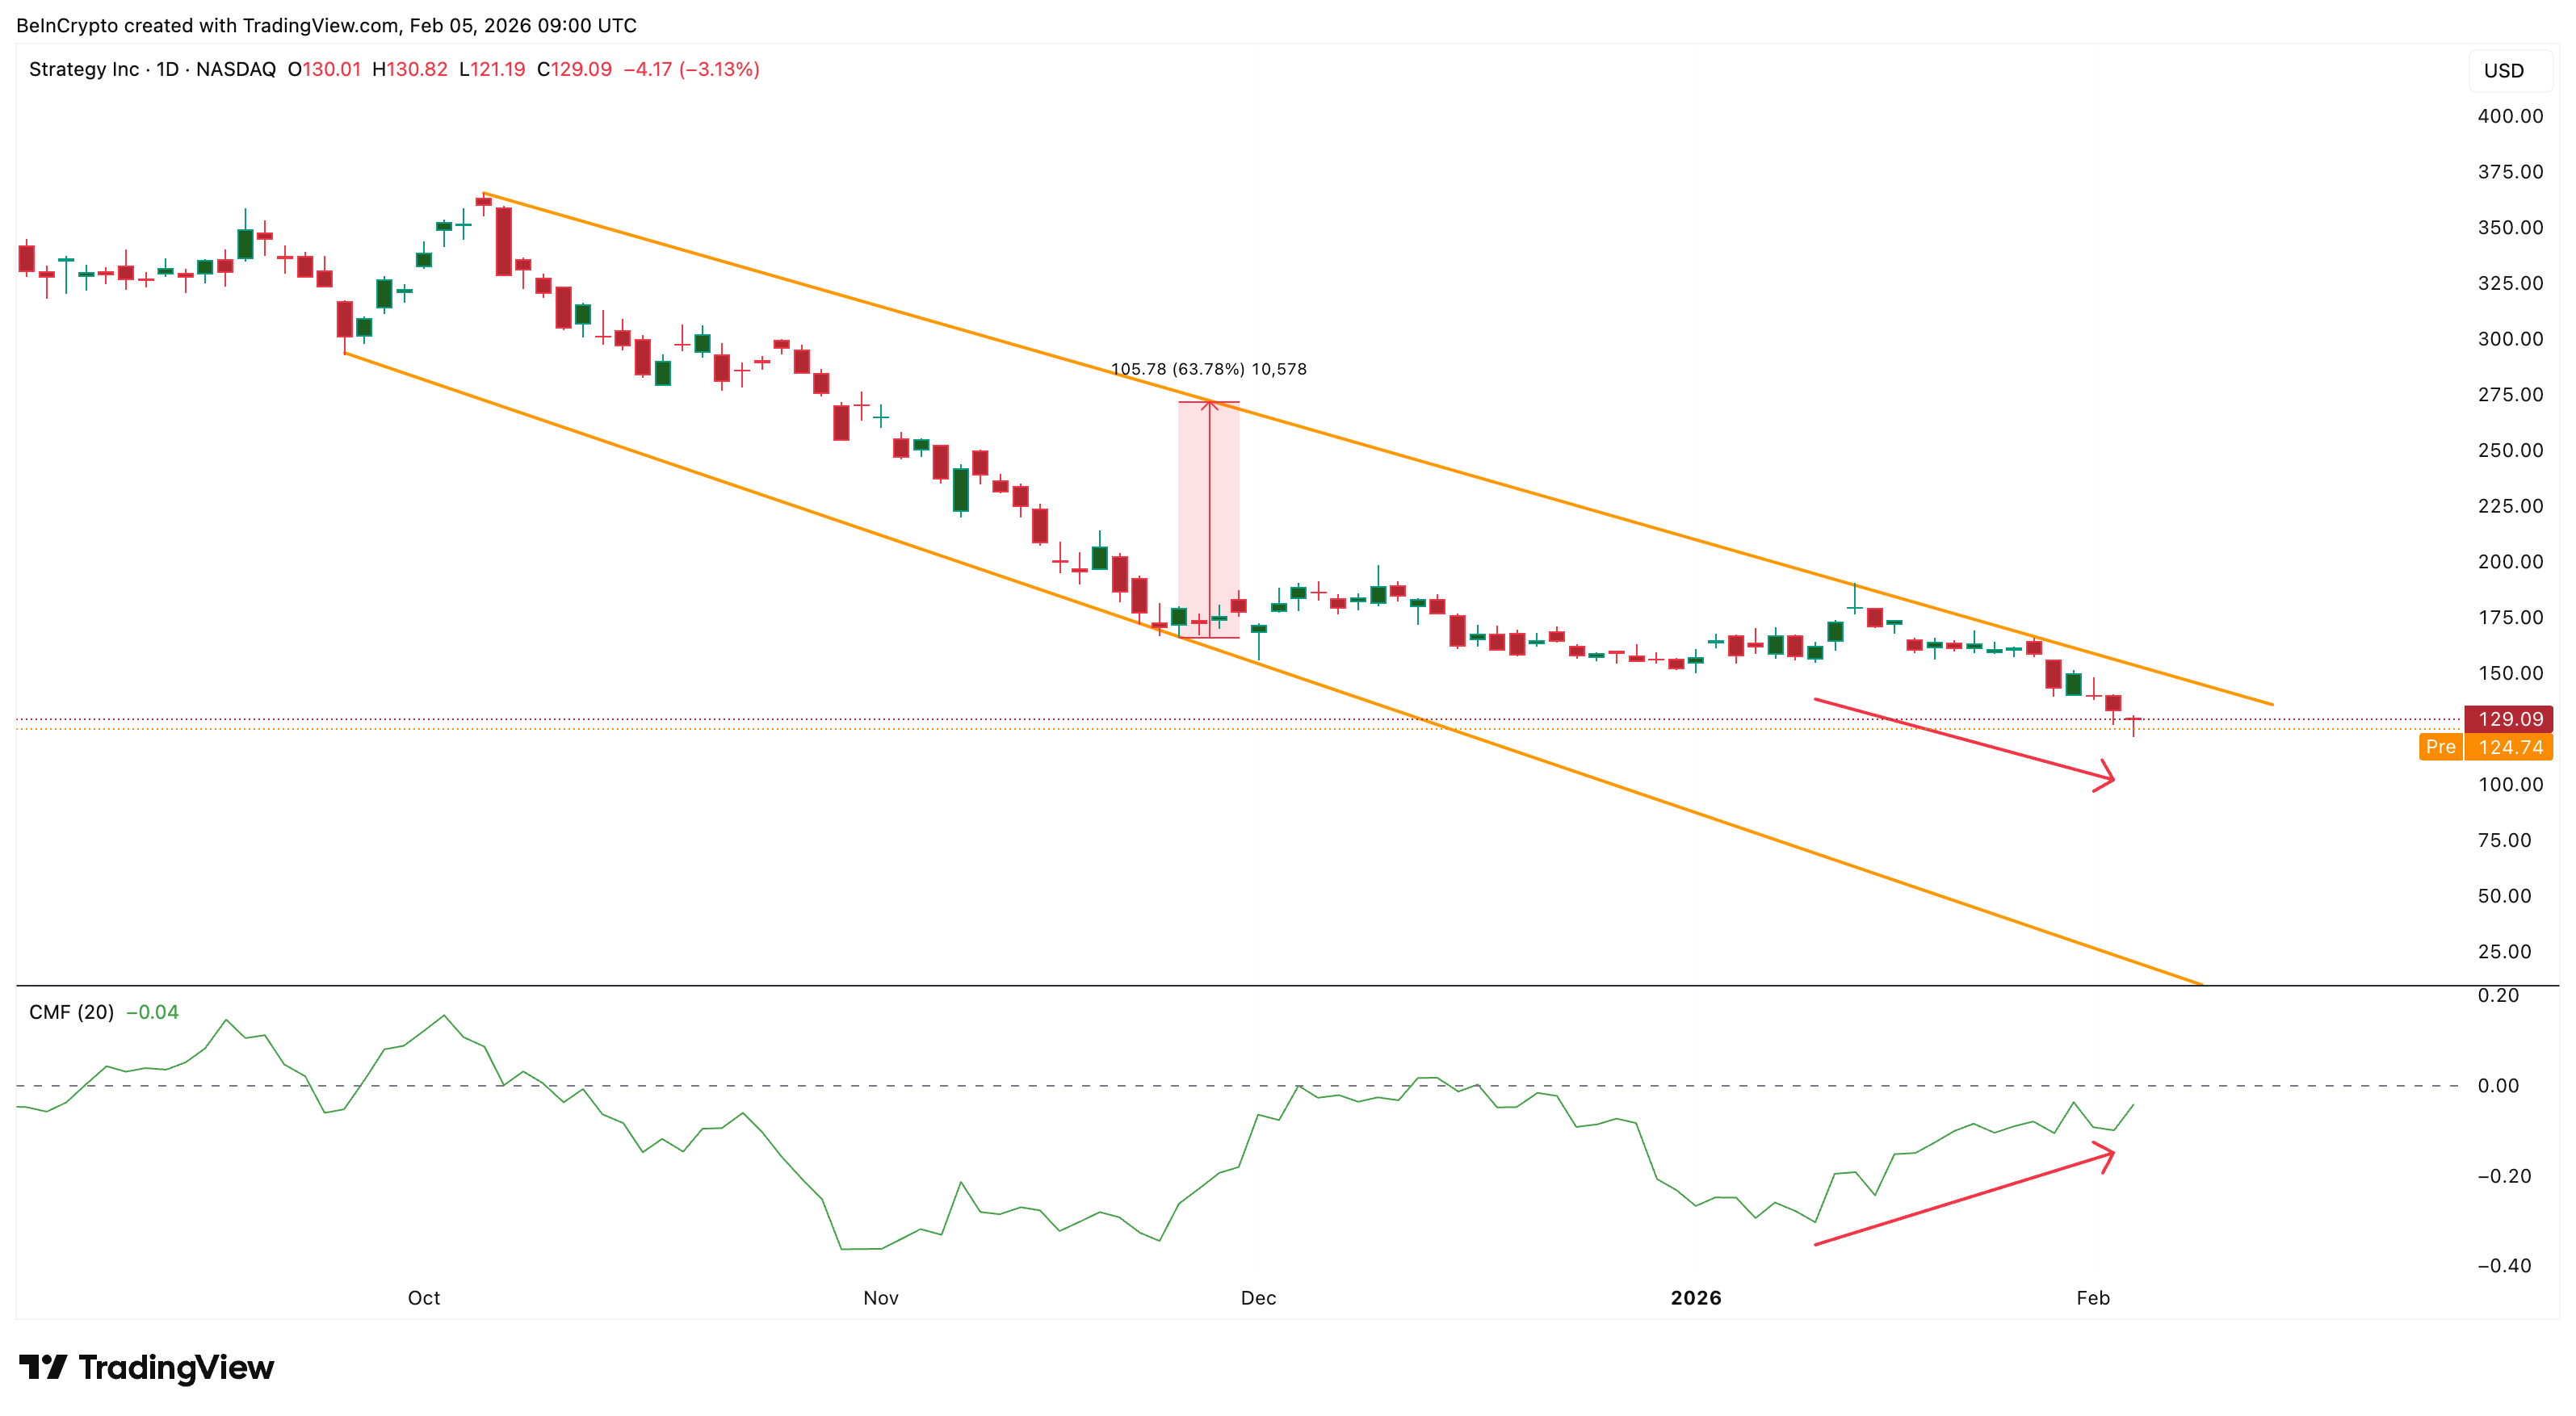
This creates a bullish divergence. Price is falling, but big money inflows are improving.
This lines up with recent reports showing MicroStrategy’s Bitcoin position is sitting on more than $3.5 billion in unrealized losses. Yet, large investors have not exited in panic. Instead, capital continues to flow in quietly.
Sponsored
Sponsored
Want more token insights like this? Sign up for Editor Harsh Notariya’s Daily Crypto Newsletter here.
Together, the falling wedge and rising CMF suggest that institutional buyers are still positioning for a rebound rather than abandoning the stock.
Analyst Targets Fall as MFI Shows Weak Retail Buying Pressure
While big money backs Michael Saylor’s Strategy, Wall Street sentiment has clearly weakened.
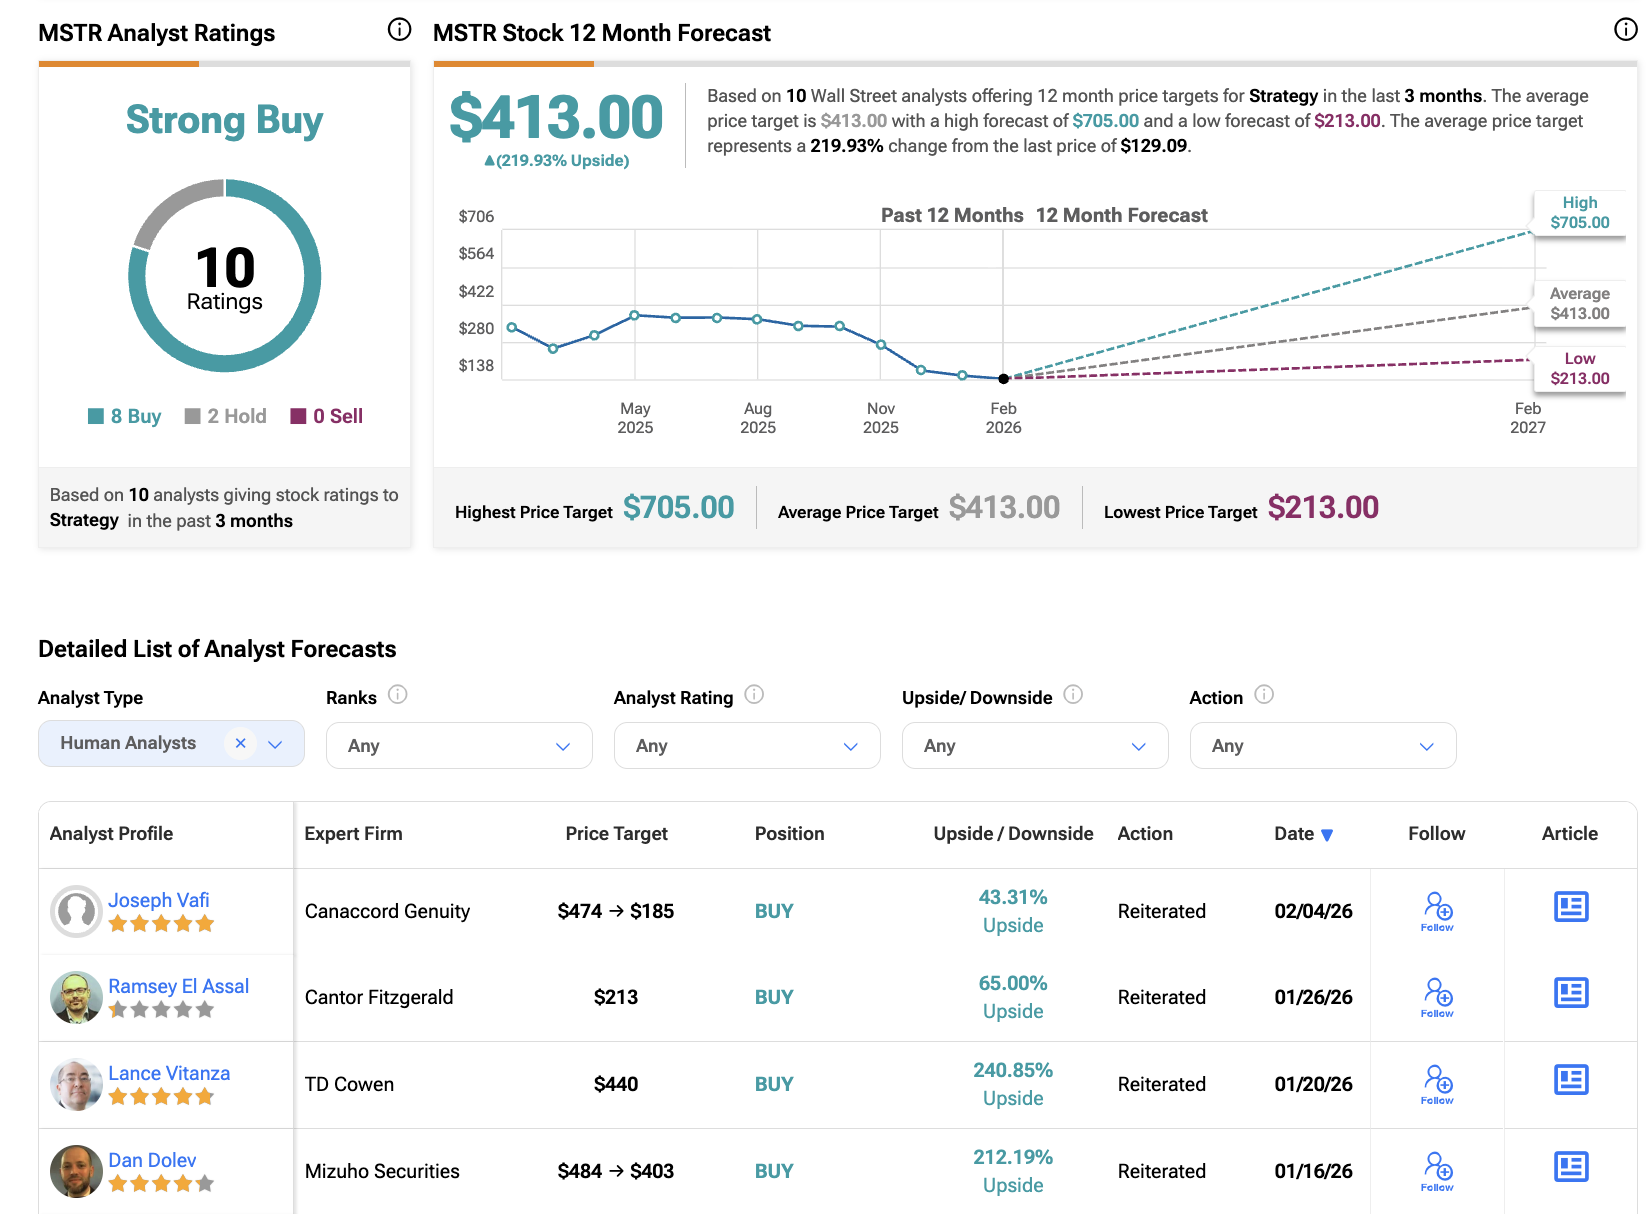
Canaccord Genuity, a financial services firm, recently cut its MicroStrategy price target from $474 to $185, a drop of roughly 60%. The downgrade was probably tied to Bitcoin’s slide and the growing risk tied to the company’s leveraged treasury strategy.
At the same time, other firms continue to rate the stock as a “buy,” keeping the average target well above current prices. This has created a clear split in expectations.
Sponsored
Sponsored
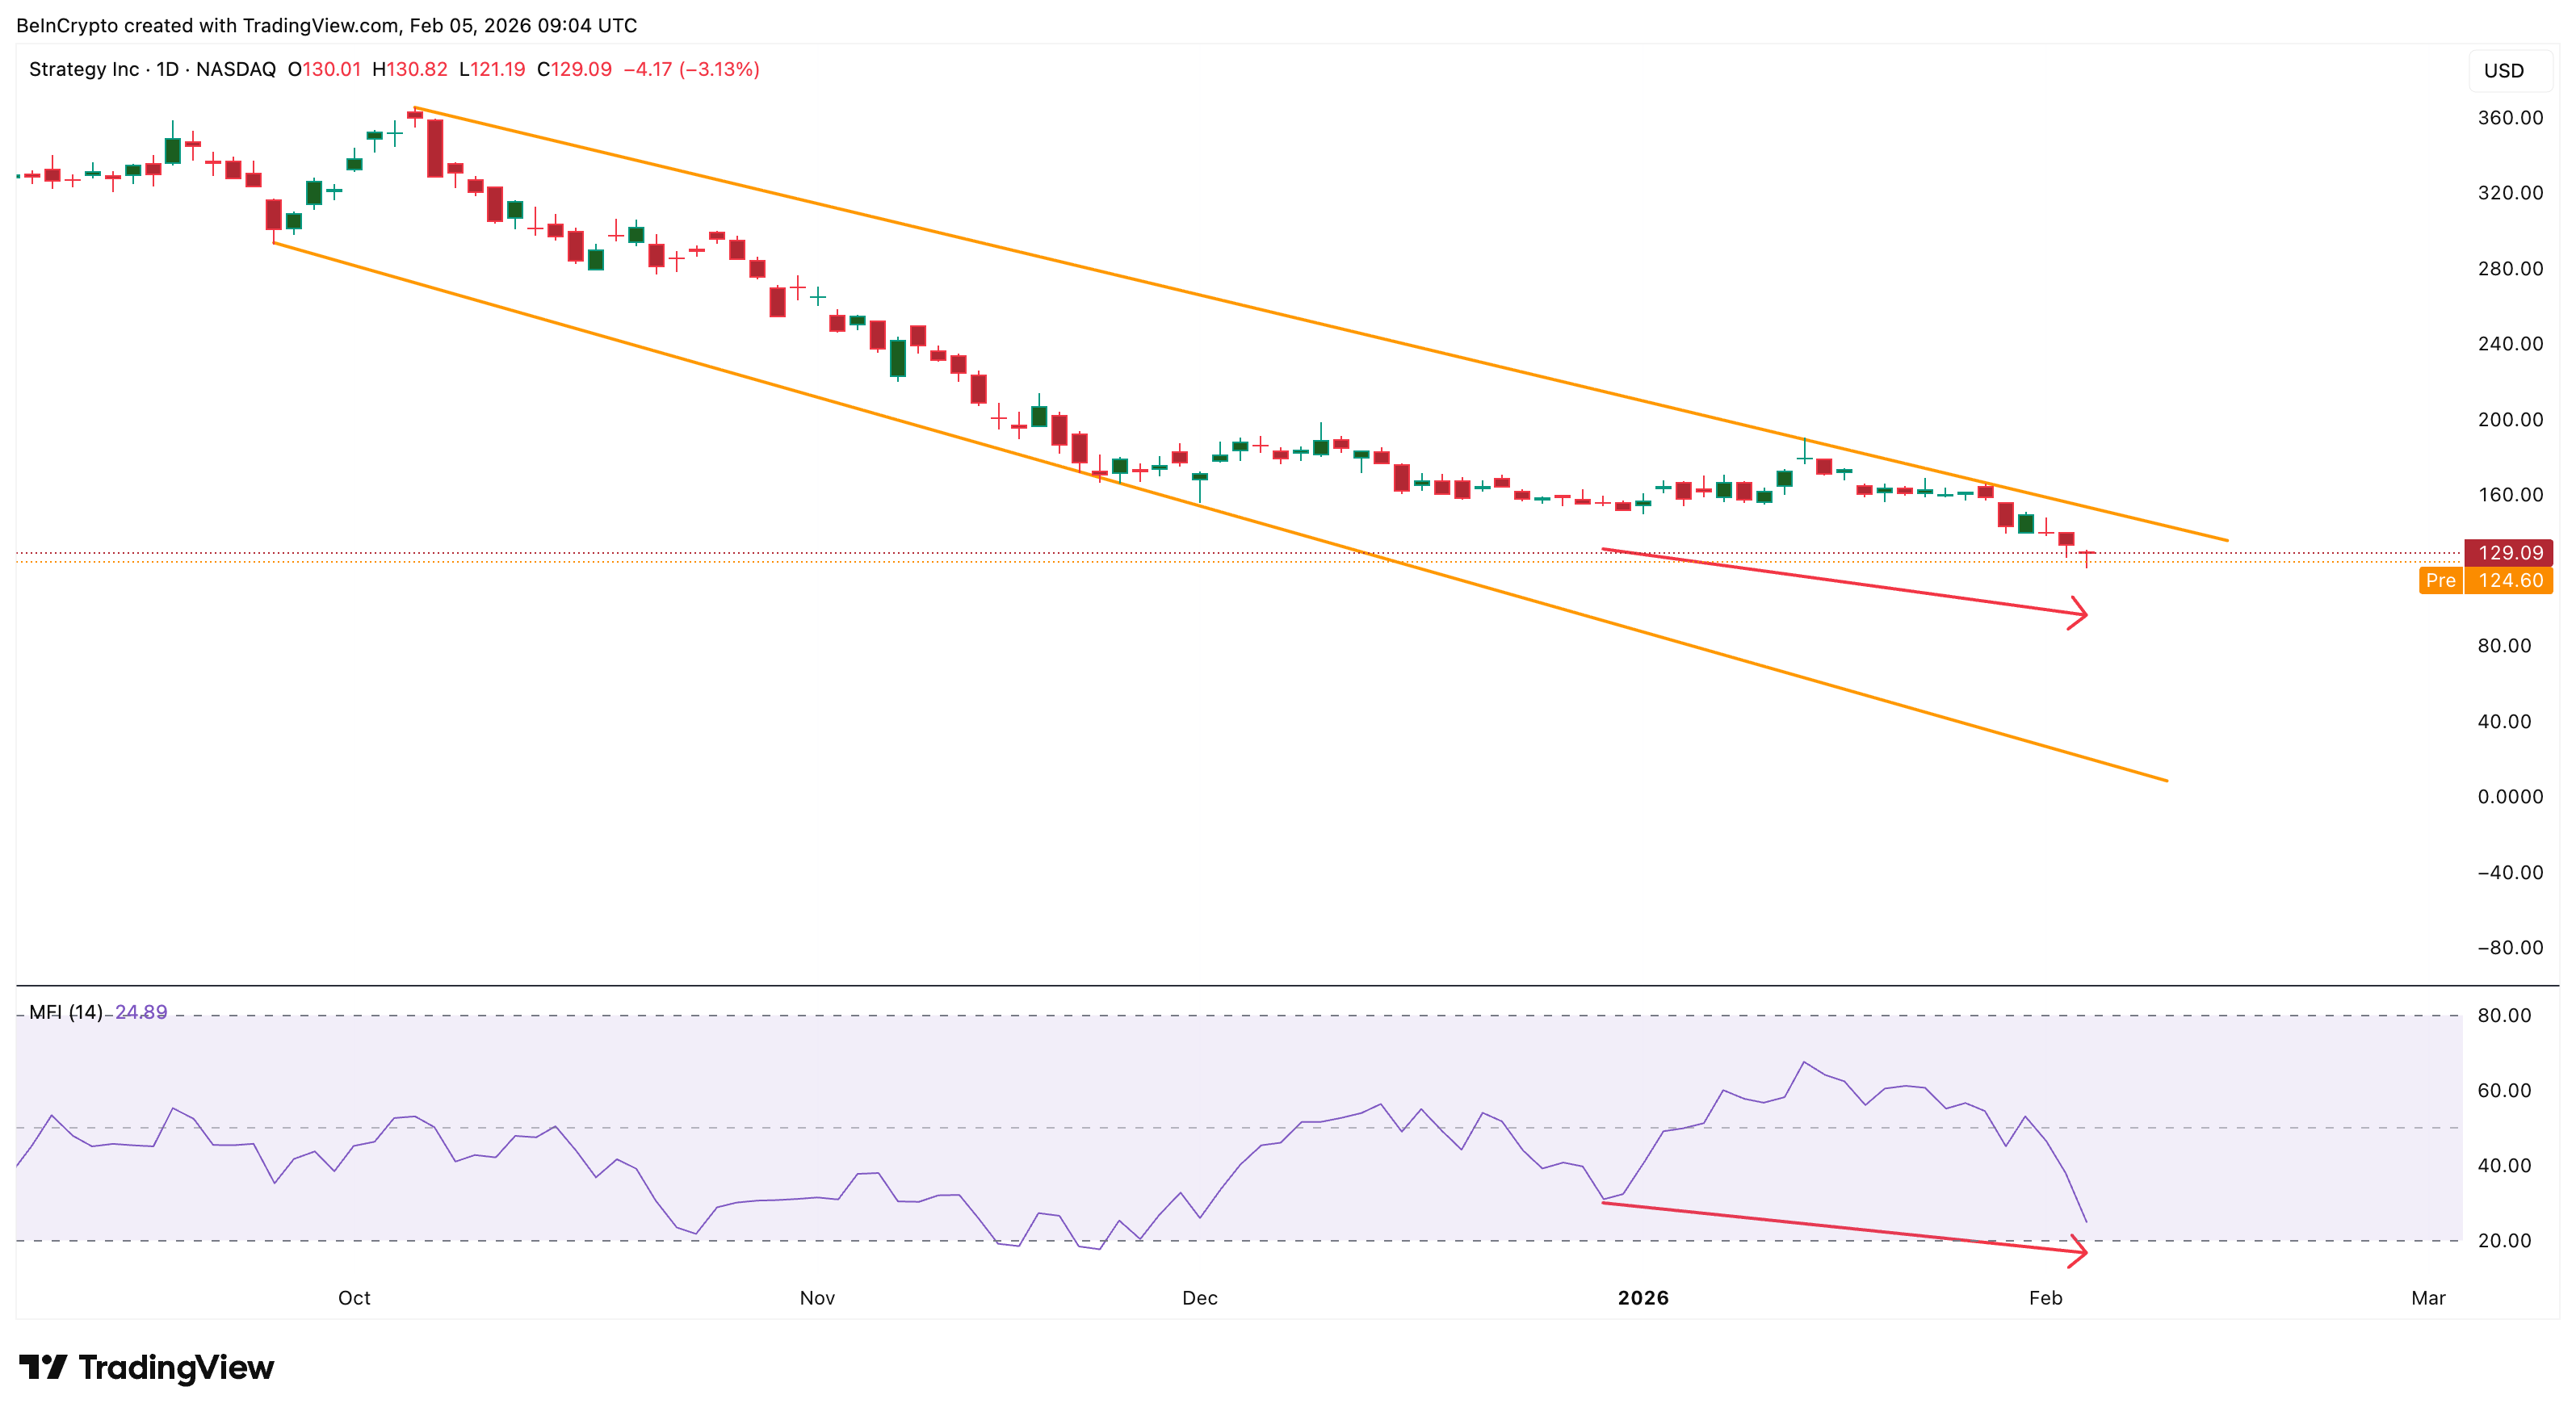
The reason for this divide becomes clearer when looking at the Money Flow Index, or MFI.
MFI tracks buying and selling pressure using both price and volume. It is often used to judge whether retail traders are aggressively buying dips or staying cautious.
Between January 30 and February 4, MicroStrategy’s price declined, and MFI declined alongside it. There was no strong bullish divergence. This means retail buyers have not stepped in aggressively yet. In simple terms, big investors are accumulating, but smaller traders remain hesitant.
This conflict is the key. Sustainable rallies usually need both institutional support and strong retail participation. Right now, only one side is clearly present.
That hesitation helps explain why some analysts are lowering targets, even as others stay optimistic.
Sponsored
Sponsored
Key MSTR Price Levels To Track Now
The final piece of the puzzle comes from price structure and support levels.
For MicroStrategy to regain technical strength, it must first reclaim the $140 zone. This area acts as both psychological resistance and trend confirmation. A clean daily close above $140 would place the price back closer to the wedge breakout zone and near the 20-day EMA.
If the breakout happens, the next major target sits near $189. This level is important for three reasons:
First, it aligns with a major Fibonacci retracement zone. Fibonacci levels often act as strong resistance and support areas where the price reacts. Second, it closely matches Canaccord’s revised $185 target, showing that analysts are watching the same technical zone.
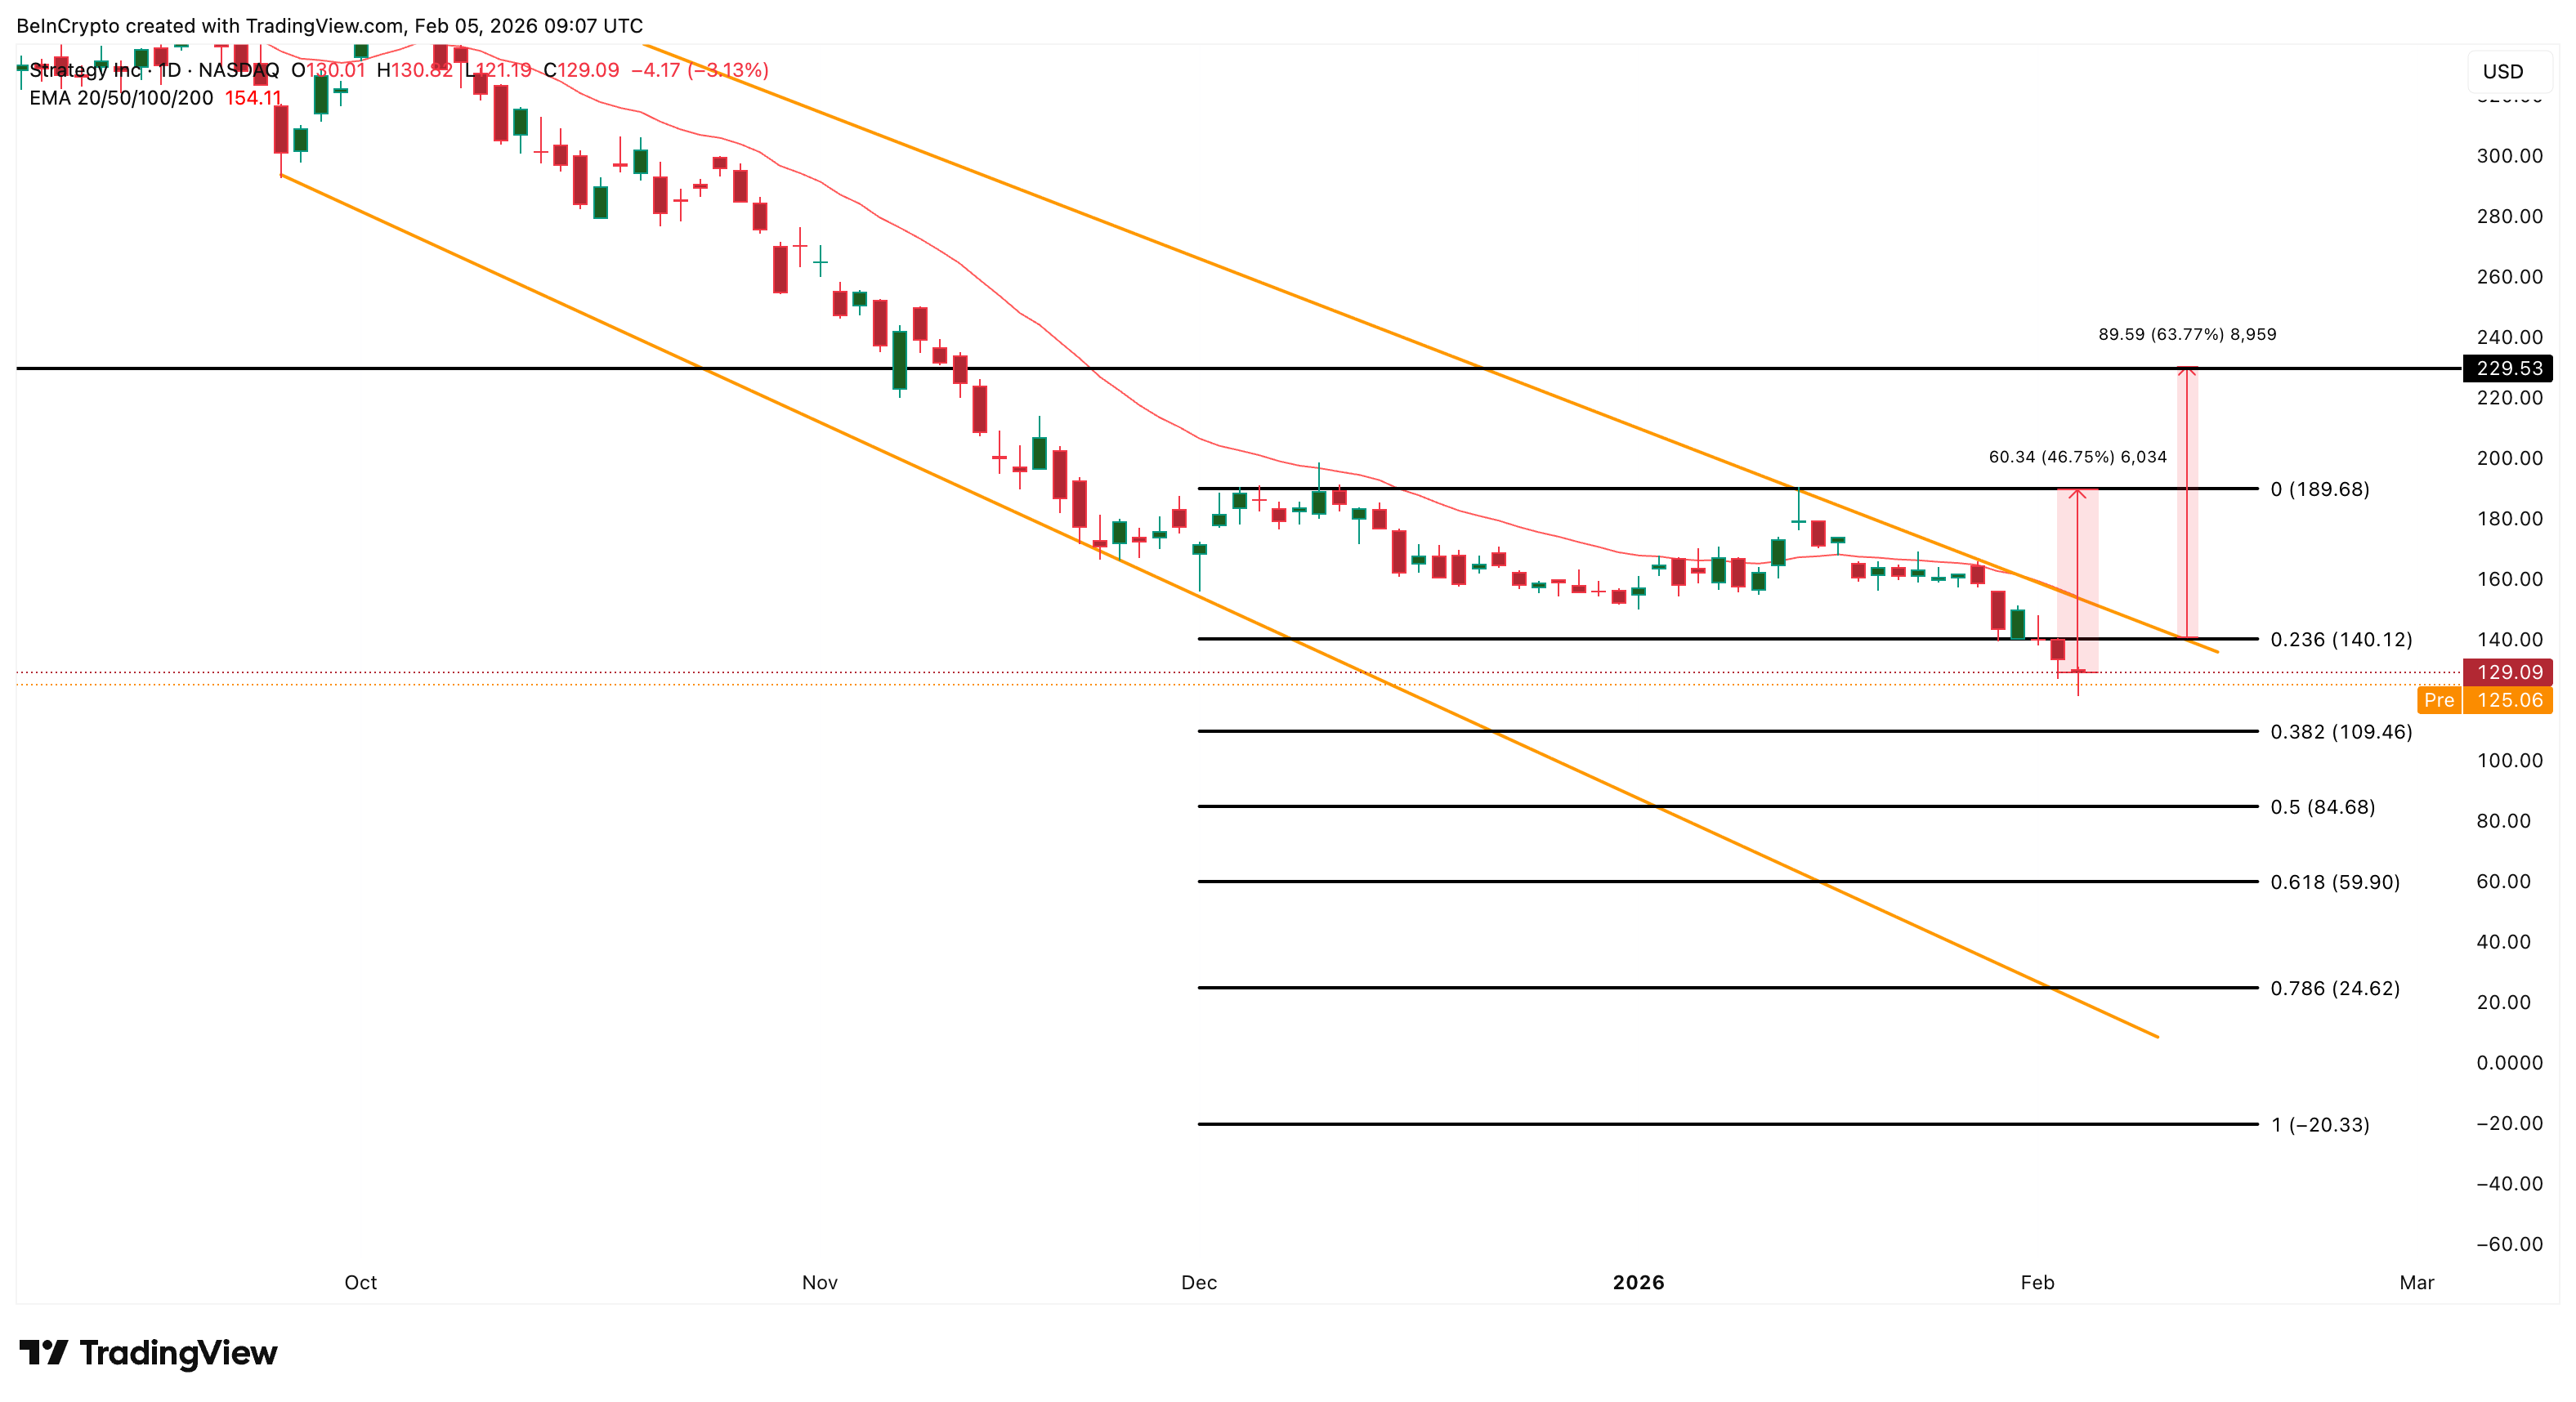
Third, it sits near the midpoint of recent consolidation ranges, making it a natural magnet for price. If $189 breaks, the falling wedge’s full upside projection points toward $225 to $230, representing roughly 63% upside from recent levels. That zone also aligns with the lower price target of the analysts.
However, failure to reclaim $140 would weaken the entire bullish setup. In that case, downside risk to $109 would increase, especially if Bitcoin continues to fall.