


In the final week of July, the total open interest in the crypto derivatives market remains historically high, exceeding $200 billion. Any significant price movement now could trigger massive losses for both long and short positions.
However, a few altcoins are showing signs of potential large-scale liquidations this week. Let’s take a closer look at which ones.
1. Ethereum
Ethereum has been surrounded by positive news about institutional accumulation in recent months. At times, its inflows even outperformed those of Bitcoin ETFs. More recently, SharpLink Gaming acquired 77,206 ETH worth $296 million last week, raising its total holdings to 438,000 ETH.
These bullish developments pushed ETH close to the $4,000 mark in the last week of July. Many analysts expect ETH to hit $4,000 soon—or even surpass it. But this level also acts as a strong psychological resistance, where profit-taking could emerge at any moment.
“A key resistance level ahead for Ethereum $ETH is $3,980. Breaking above it could ignite a major bull rally!” crypto analyst Ali Martinez commented.
Regardless of direction, the liquidation map shows that potential liquidations could reach billions of dollars if ETH moves significantly.
According to Coinglass data, if ETH breaks above $4,000, total accumulated short liquidations could reach $1.2 billion. On the other hand, if ETH faces strong profit-taking and drops to $3,500, long liquidations could soar to $7.8 billion.
The map also reveals an imbalance between longs and shorts, indicating that many traders are betting more money and leverage on a downward correction.
2. Solana
Although Solana still needs to rise over 50% to revisit its early-year high of nearly $300, its open interest has already exceeded $11 billion. That’s over 25% higher than when SOL peaked in January.
This suggests that traders are more exposed to Solana now than in the past. However, most of this exposure comes from derivatives rather than spot trading.
CoinMarketCap data shows that SOL’s current daily spot trading volume is just over $6 billion. That’s far below the tens of billions seen in January.
This wide gap between derivatives and spot volume reflects that Solana traders are leaning toward short-term bets. As a result, the token is prone to sharp swings and potential liquidations.
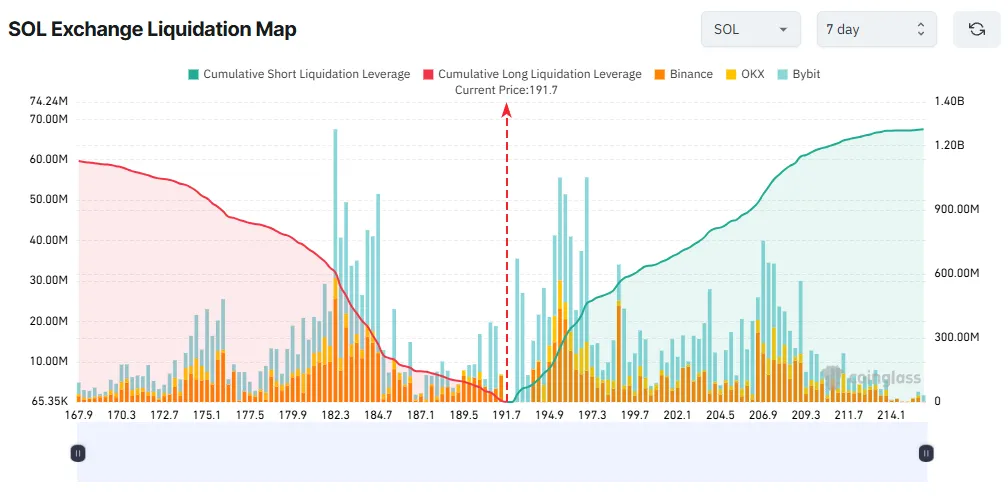
The liquidation map shows a balance between long and short positions. With SOL trading around $191, a move above $200 could trigger more than $600 million in liquidations. Conversely, a drop to $181 could liquidate over $700 million in long positions.
3. BNB
Entering the last week of July, BNB hit a new all-time high of $859. This rally was fueled by growing activity on BNB Chain and increased interest from companies in the BNB treasury.
While BNB hasn’t shown signs of a pullback yet, the BNB/USDT liquidation map on Binance reveals heavy leverage—up to 50x.
The map is almost entirely covered in yellow (indicating 50x leverage), especially around the $753 to $875 range.
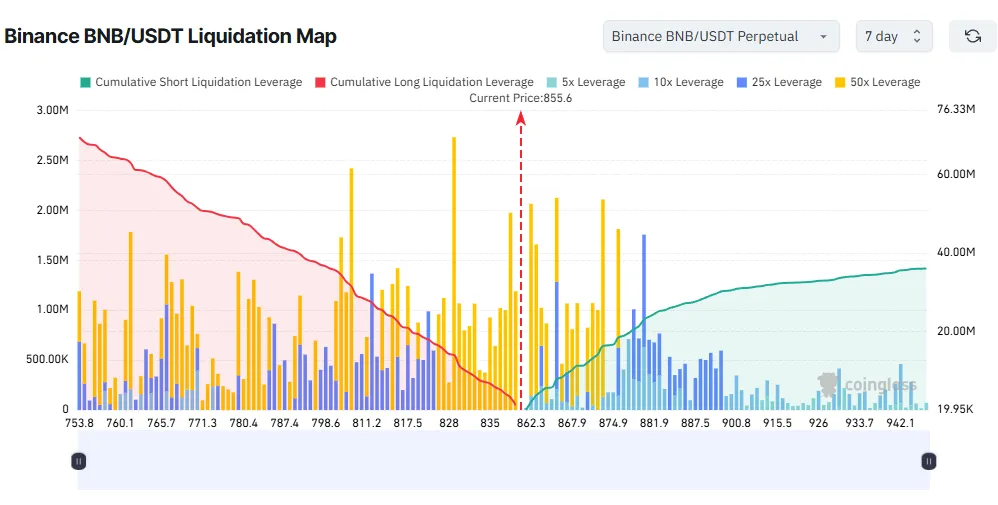
On Binance alone, total long liquidations outweigh shorts. If BNB surpasses $875, short positions worth $18.5 million could be liquidated. On the other hand, if BNB drops below the psychological $800 mark, more than $36 million in long positions would be wiped out.
Ignoring short-term noise, many analysts believe BNB could soon reach $1,000. However, some offer a more detailed view, suggesting that the price might first fall below $800 before resuming its uptrend.
Disclaimer
In adherence to the Trust Project guidelines, BeInCrypto is committed to unbiased, transparent reporting. This news article aims to provide accurate, timely information. However, readers are advised to verify facts independently and consult with a professional before making any decisions based on this content. Please note that our Terms and Conditions, Privacy Policy, and Disclaimers have been updated.